Where are the Gains?

This week in gratuitous visualisations with little or no analytic value, I thought I’d show where each team’s passing gains are coming from this season. Below you can see, for each EPL team, the proportion of gains coming from passes into the left, centre, or right thirds of the pitch – so just to be clear, a long ball from the right hand side to the left is notched up as a gain on the left. Ignore units for now, it’s the relative sizes that I think are interesting.

Passing Gains

You’ll immediately note a few things:

  • Man Utd and Spurs in the aggregate make backward passes to the middle of the field. These are the teams most obviously utilising a pivot, as they recycle possession from wing to wing probing for an opening.
  • Arsenal’s Sanchez-powered left wing has made more gains than any other attack in the Premier League.
  • Everton and Southampton are two teams making big gains in the centre of the field. I’d be interested to see in either team’s case how this possession progresses, because in Everton’s case they often run into dead ends centrally.
  • There’s hope for Newcastle down that right hand side, with Moussa Sissoko’s club-leading 4 assists.
  • West Brom don’t seem particularly penetrative, as Tony Pulis concentrates on reaching the heat-death of the universe with as many clean sheets as possible.
Where are the Gains?

The Van Gaal Press

People have noted this season (particularly in the wake of the weekend’s dire Manchester derby), that midfielders are playing very deep against Manchester United. The trend is so noticable it’s hard to believe this is merely a tactical choice by the opposition, it seems to be a result of Louis van Gaal’s system.

To investigate, I’ve calculated touch and pass position data for central midfielders that have faced each team this year, shown below. The numbers show the average touch, pass origin and pass destination positions for all centre midfielders that have faced each team (the scale being 0-100, with 50 the half-way line):

Team Avg Touch Avg Pass Origin Avg Pass Destination
Manchester United 44.51926063 47.14841735 51.55053695
Leicester City 45.05928718 47.32132381 52.12353278
Manchester City 45.4496121 48.24134365 53.19319751
Liverpool 45.89123026 48.95034476 54.04786207
Swansea City 46.18809823 48.32293877 53.11346676
Southampton 46.25431495 49.22049595 54.61689272
Chelsea 46.50900395 49.70079151 54.99465714
Arsenal 46.8681167 50.68533242 55.81001527
Tottenham Hotspur 47.03199819 49.89996785 54.3030956
Norwich City 47.14109456 50.31740135 54.9030868
Aston Villa 47.45585136 49.54328543 53.8444452
Crystal Palace 48.13725296 51.21570527 55.9466553
Watford 48.24922592 50.75826777 56.71823835
West Ham United 48.77145302 51.10018841 56.01941418
Bournemouth 48.83120838 51.76185565 55.25849846
Everton 48.94061809 51.58424266 56.5168618
West Bromwich Albion 49.51670881 52.29698356 56.89588286
Newcastle United 49.94203841 52.23178746 56.66736148
Sunderland 50.02737643 52.0606335 57.20442918
Stoke City 50.58672432 52.27340464 56.65906781

First, average of averages klaxon, I’m actually calculating the average position of each centre mid in each game, then taking the average of those. That’s slightly naughty, but if you think of the first average as the player’s position within a system, we’re really just averaging out the systems, so I’m alright with it. I also think in at least one case, I’ve miscategorised players playing 4-1-4-1.

Manchester United sit at the top of this table – their opponents have less space to work with in the centre than any other team this year. But how are they doing it? Rewatching a few games, there are a couple of reasons.

First, it’s entirely possible that opponents are just giving Man Utd respect. If you push up against Man Utd’s centre and lose the ball, often they’ll switch it out wide and counter. Contrast Man Utd’s numbers to Everton’s above, another ostensibly possession-oriented side – if you lose the ball to Everton, Ross Barkley is just going to run into a dead end and give you the ball back, or they’re going to whack it forward for it to bounce off Romelu Lukaku with his back to goal. There just isn’t that same threat, but I don’t think this is the primary reason, and I don’t know why Man Utd would have more of a fear factor than City and Arsenal.

A second observation is that, Man Utd’s attackers have been very good defensively. Wayne Rooney has done few things well this season, but he’s actually doing a good job as a defensive forward, winning 8 of his 11 tackles in the opponent’s half, and dropping deep to press. Juan Mata has also attempted a surprising 14 tackles in the opponent’s half. It’s clear than Man Utd are defending well as an entire team.

But thirdly and most importantly, I think van Gaal has instructed his players to press in the centre of the field to the point that it sometimes looks like they’re man marking opposing playmakers. One thing I’ve noticed is that Rooney, Herrera and others are constantly communicating to pick up players in the centre:

It’s clear there’s a lot of organisation here, to keep central midfielders from having space anywhere near the centre circle, so it must be an explicit tactical instruction. But how did this all fall down against Arsenal?

First, somewhat ironically, Santi Cazorla seemed entirely happy to drop very deep, and his long passing was hitting the mark. There were also constant communication problems between Bastian Schweinsteiger and Memphis Depay over whose job it was to pick him (or indeed anyone) up. Lastly, Arsenal’s movement in the centre was just excellent that day, with Cazorla often drifting to make space for Aaron Ramsey dropping deep.

Arsenal’s first goal ultimately came from Depay wandering inside, unsure who to pick up, leaving Arsenal space to break (albeit skilfully) down the right hand side.

It’s possible you’ll disagree with my interpretation of the games, but there is no doubt that Manchester United have been very affective at driving opposition central midfielders deep, and I think the per-team data is very interesting to study going forward.

The Van Gaal Press

Ultimate xG Suckerpunches

This made gruesome viewing during Michael Caley‘s xG roundup of yesterday’s Europa League games:

xG map for @AZAlkmaar-Augsburg. Man oh man does that look like a harsh result for AZ.

— Michael Caley (@MC_of_A) October 22, 2015

I don’t actually have Europa League data, but I thought it would be fun on a Friday afternoon to find all the games where the team with superior xG has been defeated 1-0 by the lowest xG shot in the game. Here is the small and miserable group:

Date Home Team Away Team Home Score Away Score Winning Goal xG Home xG Away xG
2013-10-21 19:00:00 Celta de Vigo Levante 0 1 0.027402 1.06464 0.343559
2014-04-12 15:07:00 Stoke City Newcastle United 1 0 0.029598 1.142455 1.444735
2014-05-18 17:00:00 Real Valladolid Granada CF 0 1 0.027402 0.948084 0.605783
2014-10-05 16:00:00 Guingamp Nantes 0 1 0.02931 1.259913 0.814567
2014-12-28 15:00:00 Hull City Leicester City 0 1 0.031815 1.865783 0.251423
2015-02-07 19:00:00 Evian Thonon Gaillard Bordeaux 0 1 0.03291 0.62993 0.358794

Of these, the most savage seems to be Hull and Leicester’s Christmas relegation bout, decided by a bouncing Mahrez shot from outside the box, and not cancelled out despite Hull’s 19 shots during the game. A bit of luck apparently goes a long way, and we all know how this tale ended for the two teams involved, with Hull relegated, and Leicester’s luck continuing.

Ultimate xG Suckerpunches

Visualising Centre of Gravity

Gab Marcotti, talking on the excellent Analytics FC podcast a couple of weeks ago, mentioned a stat that’s sometimes talked about in Europe, but less so over here in the UK – a team’s centre of gravity. This is a single point on the field that shows the team’s average position. It might not seem hugely revealing taken in isolation, but comparing teams, matches, or seasons, you can see some movement and draw some conclusions.

I thought about ways to visualise this, and thought just a couple of dots on an empty pitch would be a little underwhelming, but then I realised we could go a bit further. I want to try to create the simplest possible visualisation that can give you the general gist of a team’s positioning and passing, and so I’ve calculated the following:

  1. A team’s centre of gravity in each match. This is just the average of all that team’s touches in the match.
  2. The average starting position of that team’s passing, which will hopefully show roughly where the team is using the ball and starting moves. I’ll call this pass origin.
  3. The average ending position of the team’s passes, which might reveal the length of their passes, or a preference for one wing over the other. Although note that sideways passes can cancel each-other out, so you’ll see most lines pointing through the middle – later we might want a way to show a team’s preference for forwards versus sideways passing, but we don’t have it here. Anyway, I’ll call this ending position of passes pass destination.

I’ve calculated these by using all touches, but only successful passes, and I’ve removed goal kicks and drop kicks because I feared they would somewhat skew the numbers. Let’s tell the tale of two matches and see if we can make sense of them – here’s Arsenal’s 5-2 win over Leicester from September:

ars-lei-cog

I’ll jazz these up at some point, but for now, here’s what you’re seeing: the graph represents the middle third of the middle third of the pitch, so a rectangular block in the middle, the centre spot being where the dotted axes cross. The start of the dotted line is the centre of gravity, the average of a team’s touches. The end of the dotted line, and the start of the solid line, is the pass origin – the average position in which passes were attempted. And the end of that line is the pass destination, the average position of a pass completion. The arrows show the direction of play. So what conclusions would we draw at a glance here?

  • Leicester seemed to be pushing up near the half way line. Some of this might be score effects – they only led for 5 minutes, and trailed from 33 mins onwards. But some might just be a decision to play a high line against a good attack, a decision we’ve seen blow up before.
  • Leicester’s passing was longer than Arsenal’s. Perhaps you’ll remember the long ball that led to Vardy’s opener.
  • Arsenal leaned a little to the left of the pitch, which was, incidentally, hat-trick scorer Alexis Sanchez’s side that day.

Whether or not that tells much of a story of the match on the day is up for debate, obviously I can interpret the lines to fit the facts but that proves little. But let’s compare to another Arsenal game, this time the 3-0 win over Manchester United:

ars-mun-cog

Well this is a slightly different Arsenal – much deeper, with Man Utd camped out in the Arsenal half, chasing a 3-0 deficit after 20 minutes. You’d be forgiven for perhaps interpreting the deeper Arsenal play and longer balls as a superb counter-attacking performance, but I think that’s misleading – they dominated totally early on, and then shelled effectively. That identifies straight away a risk with these visualisations, and indicates I should probably be at least splitting them into halves, or event better dividing them up for each goal. Perhaps it’s possible to fit that on one graph, who knows.

Wanna see a real counter-attacking performance? Here you go:

ars-fcb-cog

Deep again, even longer balls forwards, and Bayern compressed here as you might expected when you average their 600-odd passes.

So, I think this is an interesting way of glancing at games. It doesn’t reveal the whole story, but I think with a bit more granularity, it’s an interesting kicking off point for a game’s narrative. When I’ve got these automated I’ll start putting them out for each game, and there are a few comparisons I’d like to make in the future, e.g. Barcelona’s evolution over the last few years. If anyone has any specific requests or wants some limited data to play with their own visualisations, just get in touch.

And finally, another shout out to the Analytics FC podcast which inspired the work here!

Visualising Centre of Gravity

Vardy’s Scoring Likelihood

Two articles this morning looked at Jamie Vardy’s excellent start to the season to see if it might be sustainable. Adam Bate at SkySports concludes:

Vardy’s start to the season may have been extraordinary but the evidence is overwhelming — it has not been a fluke. Don’t be too shocked if the goals continue to go in.

Mark Thompson is slightly cooler on Vardy, writing at EastBridge:

Is Vardy genuinely good then? Kinda, but not as good as his current total suggests. If I were a betting man, I might even look up the odds of him scoring fewer than 15 in the league this season.

Building on my chance quality and save difficulty models from yesterday, I would take the over on 15 goals, but I do agree Vardy is over-performing. To analyse this, I’ve taken each player in the Premier League with more than 20 non-penalty shots, and simulated their likelihood to score at least their current number of goals given:

  1. They total shot number and their average chance quality.
  2. The number of shots on target and their average save difficulty.

This should show if they’re doing better or worse than you would expect for the chances coming their way, and also whether they’re getting lucky or unlucky with their actual shots on goal. Looking at it this way, there is only one striker luckier than Vardy this year:

Player Shots On Target Goals SoTR Conv % Scoring % SD CQ Likelihood (SD) Likelihood (CQ) Expected (SD) Expected (CQ)
Graziano Pellè 38 11 5 29% 13% 45% 43% 13% 54% 53% 5 5
Sergio Agüero 33 14 6 42% 18% 43% 42% 12% 56% 22% 6 4
Olivier Giroud 23 12 4 52% 17% 33% 39% 14% 76% 43% 5 3
Alexis Sánchez 45 15 6 33% 13% 40% 37% 12% 49% 47% 5 5
Harry Kane 33 12 2 36% 6% 17% 34% 9% 95% 83% 4 3
Jamie Vardy 36 15 7 42% 19% 47% 35% 12% 24% 15% 5 4
Romelu Lukaku 28 12 5 43% 18% 42% 34% 13% 39% 27% 4 4
Diafra Sakho 29 10 3 34% 10% 30% 34% 13% 72% 76% 3 4
Sadio Mané 26 10 2 38% 8% 20% 30% 9% 86% 72% 3 2
Bafétimbi Gomis 22 10 3 45% 14% 30% 32% 11% 66% 46% 3 3
Ross Barkley 28 9 2 32% 7% 22% 25% 5% 69% 44% 2 1
Odion Ighalo 26 9 5 35% 19% 56% 28% 10% 7% 10% 2 2
Theo Walcott 26 12 2 46% 8% 17% 33% 15% 94% 91% 4 4
Rudy Gestede 22 7 3 32% 14% 43% 25% 11% 25% 44% 2 2
Memphis Depay 25 8 1 32% 4% 13% 22% 8% 87% 88% 2 2
Riyad Mahrez 23 9 3 39% 13% 33% 21% 8% 30% 27% 2 2
Aaron Ramsey 27 8 1 30% 4% 13% 23% 10% 88% 94% 2 3
Philippe Coutinho 39 11 1 28% 3% 9% 20% 7% 92% 95% 2 3
Yaya Touré 26 8 1 31% 4% 13% 21% 9% 85% 92% 2 2
Jonjo Shelvey 21 7 0 33% 0% 0% 9% 5% 100% 100% 1 1
Troy Deeney 23 4 0 17% 0% 0% 9% 8% 100% 100% 0 2

Vardy’s 24% chance of 7 goals from his shots shows he’s probably getting lucky (only Odion Ighalo at Watford is luckier, and by quite a margin). But his most likely haul is still somewhere between 4-5 goals, which isn’t bad at all. The question of whether he and more importantly whether Leicester can continue their scoring shenanigans remains to be seen – if they suddenly learn how to defend, are we still going to see these weird Vardy-inspired fightbacks?

Vardy’s Scoring Likelihood

In the Gaps Between Models

In my Anatomy of a Shot I hinted that we might measure different component parts of xG and compare them. That’s exactly what I’m going to do in this post – take what I call chance quality, a form of xG that includes positional data but excludes the shot itself, and compare it to my expected save value for that shot. Because think about what happens between those two measurements – the first model says, “in general, teams have such-and-such a chance of scoring from some sort of shot over here”, the second says “shit, did you see that? He must have a foot like a traction engine.

What comes between those two models? Well, something resembling finishing quality, or at least good decision making. Even if a player isn’t converting a ton of chances, if they’re reliable making shots more difficult to save, they’re shooting well. If they’re taking prime quality chances but making them easy to save, well, maybe that’s rubbish shooting. That’s the theory at least, what do the numbers look like? Here’s everyone with 20+ shots in the Premier League this year:

Player Shots On Target Goals SoTR Conv% Chance Quality Save Difficulty SD/CQ SD-CQ
Olivier Giroud 23 12 4 52.17% 17.39% 14.43% 20.57% 142.57% 6.14%
Juan Mata 20 7 3 35.00% 15.00% 9.86% 15.08% 153.01% 5.23%
Sergio Agüero 33 14 6 42.42% 18.18% 12.44% 17.64% 141.77% 5.20%
Bafétimbi Gomis 23 11 4 47.83% 17.39% 14.17% 17.06% 120.40% 2.89%
Harry Kane 33 12 2 36.36% 6.06% 9.43% 12.28% 130.20% 2.85%
Ross Barkley 28 9 2 32.14% 7.14% 5.30% 7.92% 149.30% 2.61%
Jamie Vardy 38 17 9 44.74% 23.68% 15.73% 17.96% 114.18% 2.23%
Sadio Mané 26 10 2 38.46% 7.69% 9.42% 11.65% 123.63% 2.23%
Yohan Cabaye 21 8 4 38.10% 19.05% 16.11% 17.99% 111.70% 1.88%
Romelu Lukaku 28 12 5 42.86% 17.86% 12.59% 13.46% 106.91% 0.87%
Riyad Mahrez 25 11 5 44.00% 20.00% 13.27% 13.70% 103.22% 0.43%
Theo Walcott 26 12 2 46.15% 7.69% 14.68% 15.09% 102.83% 0.42%
Odion Ighalo 26 9 5 34.62% 19.23% 9.56% 9.61% 100.49% 0.05%
Graziano Pellè 38 11 5 28.95% 13.16% 12.60% 12.33% 97.88% -0.27%
Alexis Sánchez 45 15 6 33.33% 13.33% 12.17% 11.39% 93.53% -0.79%
Memphis Depay 25 8 1 32.00% 4.00% 8.09% 7.13% 88.15% -0.96%
Diafra Sakho 29 10 3 34.48% 10.34% 13.32% 11.82% 88.76% -1.50%
Philippe Coutinho 39 11 1 28.21% 2.56% 7.23% 5.68% 78.63% -1.54%
Santiago Cazorla 20 7 0 35.00% 0.00% 6.92% 5.28% 76.24% -1.64%
Jonjo Shelvey 21 7 0 33.33% 0.00% 4.83% 2.92% 60.54% -1.90%
Gnegneri Yaya Touré 26 8 1 30.77% 3.85% 9.23% 6.49% 70.28% -2.74%
Rudy Gestede 22 7 3 31.82% 13.64% 10.96% 8.10% 73.97% -2.85%
Aaron Ramsey 27 8 1 29.63% 3.70% 10.09% 6.94% 68.81% -3.15%
Jason Puncheon 20 3 0 15.00% 0.00% 7.08% 1.74% 24.65% -5.33%
Troy Deeney 23 4 0 17.39% 0.00% 8.43% 1.62% 19.28% -6.80%

I should note that the save difficulty number here, because I want an aggregate over all their shots, counts off-target shots as a save difficulty on zero. The raw number obviously averages out roughly to the global conversion rate of on-target shots (around 30%). So, we can see some players increase the average difficulty of their shots for keepers, others make them easier. I’ve calculated both the ratio (i.e. Juan Mata increases his shots’ difficulty by 1.5x), and the difference, (i.e. Juan Mata increased his shot quality of around 10% to a save difficulty of around 15%).

cq-vs-sd

To the right are better chances, top the top are better shots. You can see examples like Olivier Giroud and Sergio Agüero, who are making already quite good chances even scarier, Ross Barkley’s making bad chances look very slightly more exciting, and Jason Puncheon and Troy Deeney just need to stop.

Let’s look at a bigger sample, here’s 2014, 50+ shots:

Player Shots On Target Goals SoTR Conv% Chance Quality Save Difficulty SD/CQ SD-CQ
Nacer Chadli 54 22 11 40.74% 20.37% 9.69% 16.00% 165.11% 6.31%
Steven Gerrard 55 22 10 40.00% 18.18% 13.18% 18.66% 141.62% 5.48%
Olivier Giroud 70 29 14 41.43% 20.00% 11.49% 15.67% 136.36% 4.18%
Diego Da Silva Costa 76 37 20 48.68% 26.32% 15.22% 19.36% 127.25% 4.15%
Harry Kane 113 48 22 42.48% 19.47% 11.65% 15.71% 134.87% 4.06%
David Silva 66 27 12 40.91% 18.18% 11.51% 15.26% 132.61% 3.75%
Eden Hazard 78 33 14 42.31% 17.95% 13.94% 16.87% 121.04% 2.93%
Aaron Ramsey 63 17 6 26.98% 9.52% 8.56% 10.81% 126.27% 2.25%
Wayne Rooney 79 27 12 34.18% 15.19% 10.89% 12.66% 116.25% 1.77%
Mame Biram Diouf 55 22 11 40.00% 20.00% 17.00% 18.71% 110.01% 1.70%
Robin van Persie 76 37 10 48.68% 13.16% 13.27% 14.92% 112.41% 1.65%
Ayoze Pérez Gutiérrez 61 24 7 39.34% 11.48% 10.37% 12.02% 115.85% 1.64%
Bafétimbi Gomis 69 24 7 34.78% 10.14% 9.50% 11.10% 116.76% 1.59%
Raheem Sterling 84 33 7 39.29% 8.33% 8.96% 10.52% 117.51% 1.57%
Jonjo Shelvey 63 20 4 31.75% 6.35% 7.44% 8.92% 119.87% 1.48%
Charlie Austin 130 53 18 40.77% 13.85% 12.41% 13.86% 111.67% 1.45%
Gylfi Sigurdsson 67 24 7 35.82% 10.45% 7.50% 8.91% 118.77% 1.41%
Kevin Mirallas 52 16 7 30.77% 13.46% 7.63% 8.76% 114.92% 1.14%
Sergio Agüero 148 62 26 41.89% 17.57% 14.82% 15.75% 106.32% 0.94%
Saido Berahino 86 37 14 43.02% 16.28% 13.67% 14.59% 106.71% 0.92%
Alexis Sánchez 121 49 16 40.50% 13.22% 9.97% 10.85% 108.90% 0.89%
Charlie Adam 62 17 7 27.42% 11.29% 7.53% 8.34% 110.69% 0.80%
Sadio Mané 60 25 10 41.67% 16.67% 11.93% 12.68% 106.30% 0.75%
Christian Eriksen 97 26 10 26.80% 10.31% 7.22% 7.94% 109.90% 0.71%
Christian Benteke 80 29 13 36.25% 16.25% 12.29% 12.96% 105.43% 0.67%
Leroy Fer 54 14 6 25.93% 11.11% 8.47% 9.02% 106.47% 0.55%
Stewart Downing 70 19 6 27.14% 8.57% 6.73% 7.14% 106.10% 0.41%
Riyad Mahrez 63 24 4 38.10% 6.35% 7.65% 7.97% 104.15% 0.32%
Gnegneri Yaya Touré 89 27 10 30.34% 11.24% 8.66% 8.98% 103.61% 0.31%
Romelu Lukaku 106 43 11 40.57% 10.38% 11.56% 11.65% 100.81% 0.09%
Nikica Jelavic 57 15 8 26.32% 14.04% 10.53% 10.55% 100.23% 0.02%
Diafra Sakho 66 22 10 33.33% 15.15% 13.53% 13.52% 99.97% -0.00%
Craig Gardner 56 18 3 32.14% 5.36% 7.57% 7.49% 99.01% -0.07%
Wilfried Bony 89 35 11 39.33% 12.36% 11.33% 11.15% 98.43% -0.18%
Danny Ings 97 33 11 34.02% 11.34% 11.41% 10.65% 93.35% -0.76%
Jordan Henderson 50 14 6 28.00% 12.00% 9.95% 9.17% 92.16% -0.78%
Dusan Tadic 53 21 4 39.62% 7.55% 11.21% 10.32% 92.10% -0.89%
Danny Welbeck 58 23 4 39.66% 6.90% 12.18% 11.24% 92.33% -0.93%
Philippe Coutinho 103 34 5 33.01% 4.85% 6.13% 5.11% 83.40% -1.02%
Willian Borges Da Silva 55 17 2 30.91% 3.64% 6.90% 5.70% 82.65% -1.20%
Jason Puncheon 65 20 6 30.77% 9.23% 6.28% 5.06% 80.63% -1.22%
Oscar dos Santos Emboaba Junior 72 23 6 31.94% 8.33% 8.43% 7.17% 85.05% -1.26%
Santiago Cazorla 93 33 7 35.48% 7.53% 12.00% 10.44% 87.04% -1.55%
Ángel Di María 61 18 3 29.51% 4.92% 6.06% 4.38% 72.26% -1.68%
Yannick Bolasie 69 19 4 27.54% 5.80% 7.49% 5.80% 77.43% -1.69%
Abel Hernández 52 19 4 36.54% 7.69% 11.66% 9.95% 85.33% -1.71%
Gabriel Agbonlahor 53 17 6 32.08% 11.32% 11.33% 9.34% 82.39% -2.00%
Ross Barkley 51 14 2 27.45% 3.92% 7.31% 5.27% 72.01% -2.05%
Connor Wickham 83 24 5 28.92% 6.02% 9.04% 6.88% 76.11% -2.16%
Enner Valencia 72 21 4 29.17% 5.56% 10.62% 8.05% 75.77% -2.57%
Ashley Barnes 66 21 5 31.82% 7.58% 11.15% 8.33% 74.71% -2.82%
Graziano Pellè 123 38 12 30.89% 9.76% 14.29% 10.80% 75.61% -3.49%
Mario Balotelli 56 20 1 35.71% 1.79% 10.08% 6.51% 64.60% -3.57%
Peter Crouch 59 17 8 28.81% 13.56% 13.07% 8.63% 65.99% -4.45%

Which in turn looks like this:

cq-vs-sd-2014

Steven Gerrard’s numbers here are padded a bit by penalties, but he took good penalties, so you can see the boost he gets. Costa was a monster, Nacer Chadli was incredibly sharp (though seems to have crashed hard this season, basically halving the xG on every shot). Ross Barkley’s chances were just as bad, but unlike this year, they didn’t go in. Jason Puncheon just needs to stop.

So this is fun, but is it really any more interesting than conversion rate et al? Let’s look at how predictive each season is of the next. I’ll limit it to full seasons, players with 50+ shots. Here’s how various metrics perform:

Metric R2
2011-2012 2012-2013 2013-2014
SoTR 0.1967 0.041 0.0215
Conversion 0.4299 0.1271 0.2224
Scoring % 0.1844 0.0228 0.0584
SD/SQ 0.2122 0.2436 0.1161
SD-SQ 0.3498 0.2729 0.0929

While it’s clear we haven’t found the holy gail of a strongly repeatable shooting metric, I still like our composite model. It has the benefit that as my chance quality and save difficulty models get better, these numbers may also improve, and I’ll be sure to look into that.

At the very least, I think the idea of having small, granular models, and looking at the gaps between them is an interesting way to find some new metrics and insights, and I’ll see what else I can find with a similar approach.

In the Gaps Between Models

Anatomy of a Shot

Expected goals is one of the most predictive stats available in football, and once you understand it, one of the most intuitive. But the reality of how it’s formulated is still pretty nebulous – different models encompass different variables, ultimately predicting different things.

Let’s take a moment to understand why xG exists – what does it help us do? Well, we know that stuff happens on the football field. We know players get lucky bounces, we know good players have bad games, we know good teams sometimes have to play bad players, we know the same defender can dominate or fall apart from week to week. Birds even poop in players’ mouths. RIGHT IN THEIR MOUTHS, PEOPLE! And so we ought to be able to analyse a team or player’s performance while being sympathetic to these issues. Expected goals does just that – it forgives players and teams for a whole bunch of stuff that they might not have control over. Plus, purely empirically, expected goals just performs well as a predictor.

Quick, analyse this: a player has only 0.5 xG of shots in a game and doesn’t score. Should you get on their back? Are they feeding off scraps? Is their positioning crap? Shooting too early? Waiting too long to shoot? We have no way of knowing with a single headline xG figure, because so much goes into it. So part of my motivation in writing this increasingly long and rambling piece is to map out every possible factor that goes into a shot – how a shot becomes a goal, if you will – highlighting the parts that go into common models, and the parts that are under-represented. I’m then going to argue that expected goals could be split into four separate models with much better names. Then we’ll ignore that suggestion and carry on as before.

Dissecting Shots

Game State

Without even touching the ball, certain factors affect shot creation. A team may be behind and chasing the game, a team in the relegation zone may need a goal against someone with nothing to play for, you club’s greatest ever manager may have died before the game, giving you the fire and passion to… crumple before an old enemy. Some of these things are measurable – score effects most obviously, which make their way into many common models.

Buildup

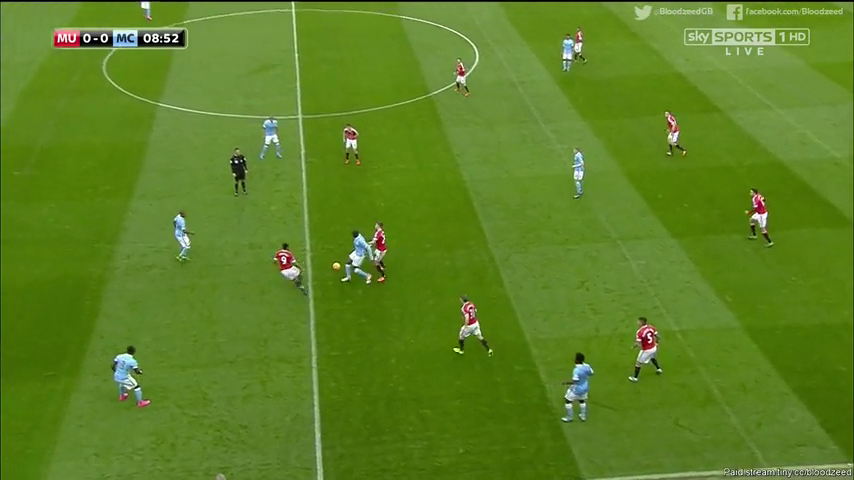
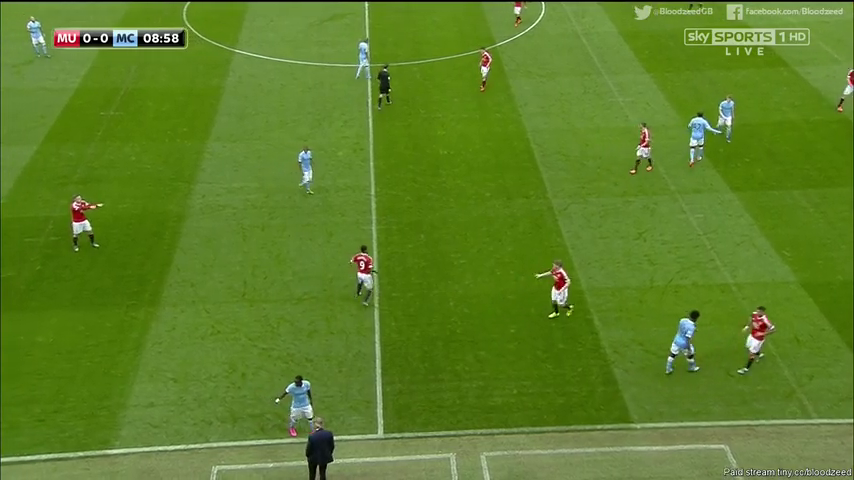
Shots don’t exist in a vacuum – they’re the product of through-balls, corners, counter-attacks etc. Even with perfect information about on- and off-the-ball positioning, we would still be interested in how a player came to be in a shooting position because of their physical momentum or the psychological pressure of certain situations. Models might include any or all of the following:

  • Was this a corner, or a direct or indirect free kick?
  • Was this a counter-attack? That is, was there a turnover of possession followed by some sort of fast, vertical attacking move.
  • Was the shot the result of possession-based buildup? We can measure a certain number of consecutive passes leading to the shot, for example.
  • Was this a great piece of individual play?

In an ideal world, we’d be able to track the complete passage of relevant play leading to a shot – every pass and dribble, their exact times, every player position. Some of this is possible today, and over the coming weeks I’ll talk more about the model I’m currently developing, Deep xG, that incorporates vastly more data than you might think feasible.

Assist

Aside from the buildup play, we should be very interested in the exact pass that led to a shot. The angle, height and location of a pass, whether it was a cross, all these things have an effect on a the shot ultimately taken. Many models incorporate the type of pass, and some the exact location (and the pass before that, even). You can work out the rough speed by looking at event locations and timestamps, too. Once you have this data in a model, it becomes easy to remove the striker from the equation entirely – what’s the likelihood of a goal from this pass, ignoring the type of shot ultimately taken?

Shots Not TakeN

It’s worth pointing out that for every shot a player takes, there are often several opportunities they don’t take. They take an extra touch, or opt for a pass instead. In these situations, they’re waiting for the optimum moment for a shot, and as you’d expect, models will often disagree with them. Similarly, strikers will often judge their optimal positioning differently than the players in a position to pass to them. Sometimes you’ll watch as a ball rolls agonizingly across the 6-yard box, never getting a touch. Shouldn’t that pass have an xG attached? We can easily work it out by sampling every position along the ball’s journey and calculating xG at that point, showing strikers exactly what they missed out on.
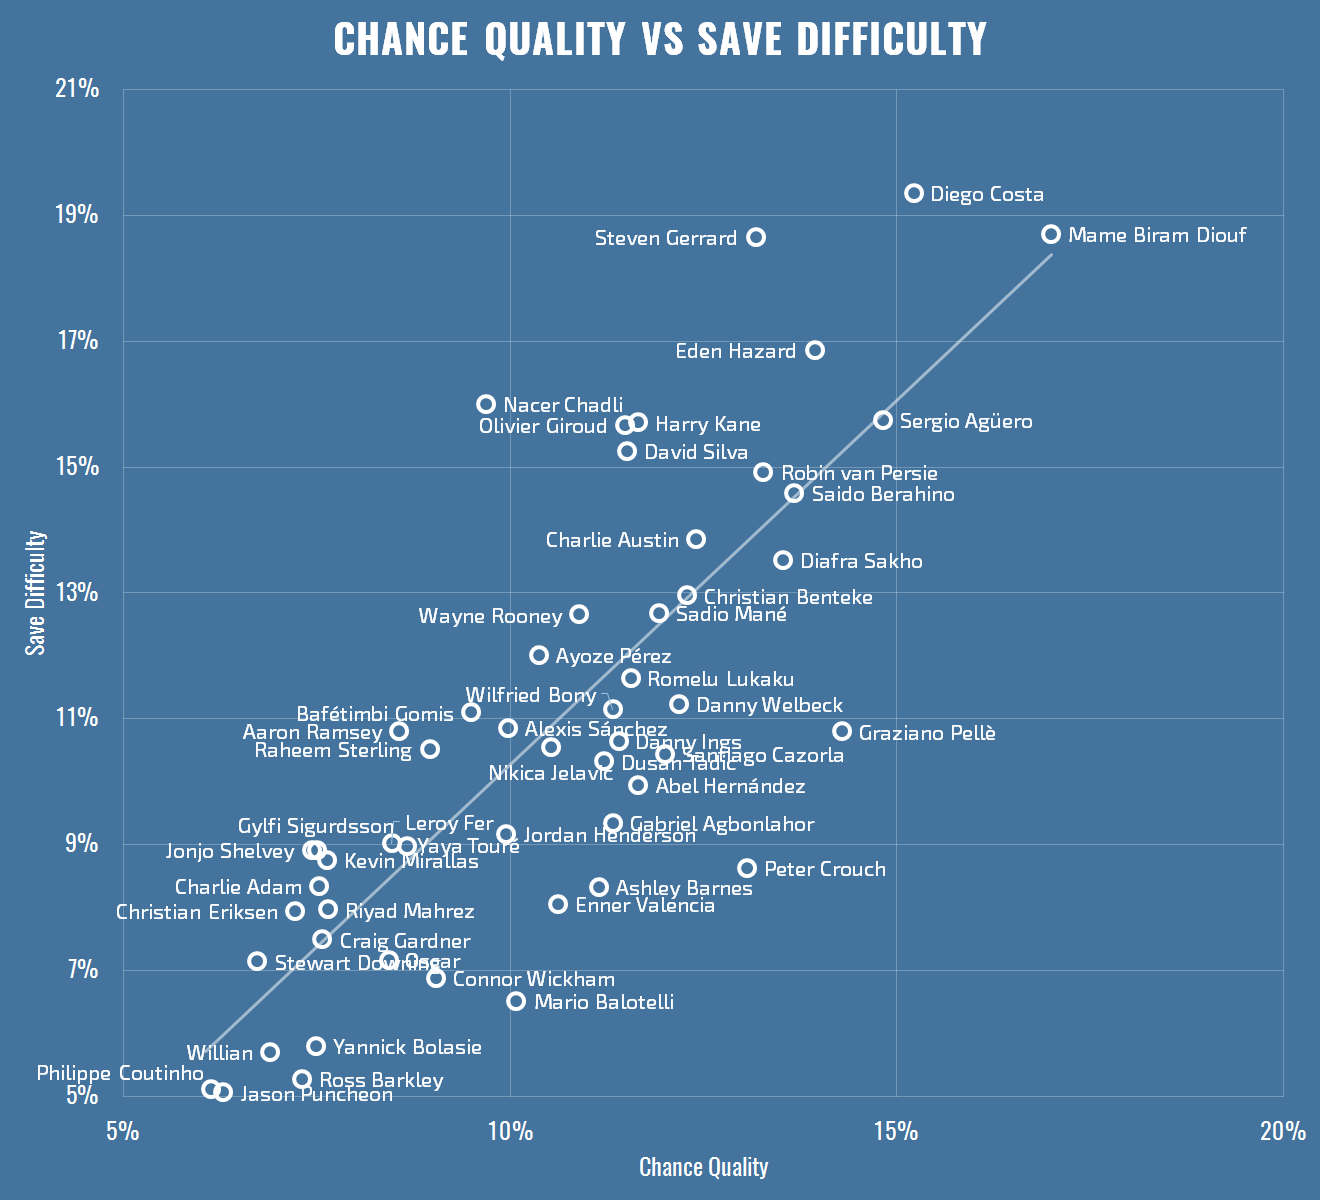
Chance Quality

This, for me, is the essence of xG – forget the striker, forget the shot, just look where and how the team is able to create chances and I think you have a good measure of their offensive production. Obviously if none of those chances ever go in, the team has problems, but at least narrow, identifiable problems at which money can be thrown. A chance quality model, therefore, will take into account location and assist info, but nothing about the shot, beyond the necessity that headers and kicks are different.

Shot Choice

Outside of the crossbar game, players don’t generally choose to miss their shots. Obviously we ultimately care about a player’s skill in converting chances, but it’s worth studying players that choose their shots in ways that optimise xG. For any given shot, we can work out the maximum possible xG for a shot from the player’s position, and compare their chosen shot to that. While we can’t possibly know what a player was actually aiming for, those that reliably choose high xG shot placement, completely aside from their actual finishing skill, can at least be said to have good instincts. Perhaps their technical difficulties can be trained or perhaps they ought to be encouraged to pursue lower-xG shots that they can more reliably hit on target. Either way, shot choice is a separate ability, and one worthy of study and focus by coaches.

Shot Execution

I’ve written a few pages now and nobody’s even touched the ball, time to put that right. Shot execution is obviously a huge factor. No matter how advantageous the attacking situation created by the team, the assist, the plan in the striker’s head, they have to actually hit the ball at the goal. A striker’s finishing skill is an elusive thing, long sought after by stats folks, and rarely reliably sighted. Ultimately you’re asking, given the likelihood of each chance going in, is the striker over- or underperforming on their shots?

Defensive Positioning

Unless TRACAB data becomes more commonly accessibly, or community efforts supplant it, we are unlikely to be able to make any major insights about defensive positioning and how it relates to attacks, shots and goals, beyond data about take-ons and mere blocks and deflections. This is the biggest missing piece of the data puzzle, and there’s not much to say beyond that. Some people have used game-state as a way of perhaps inferring defensive pressure,
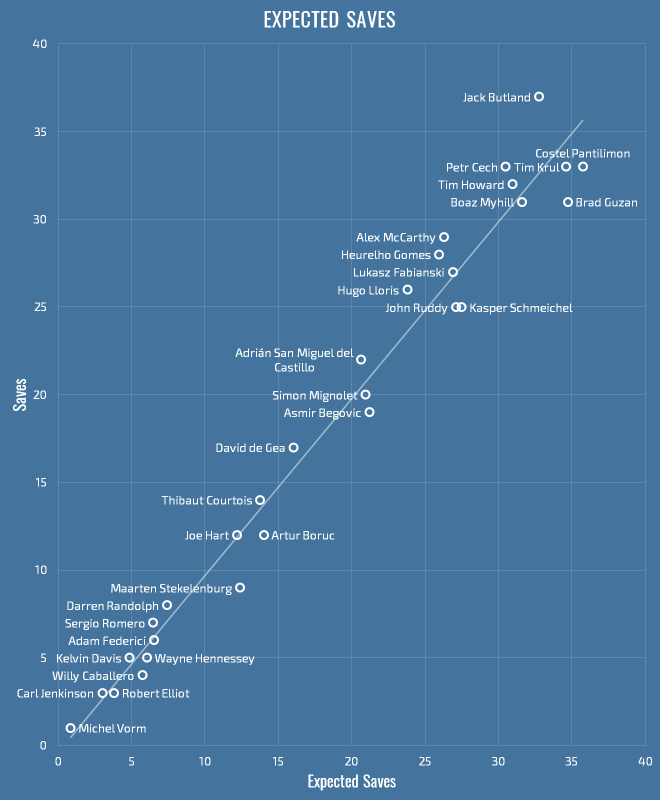
Saves

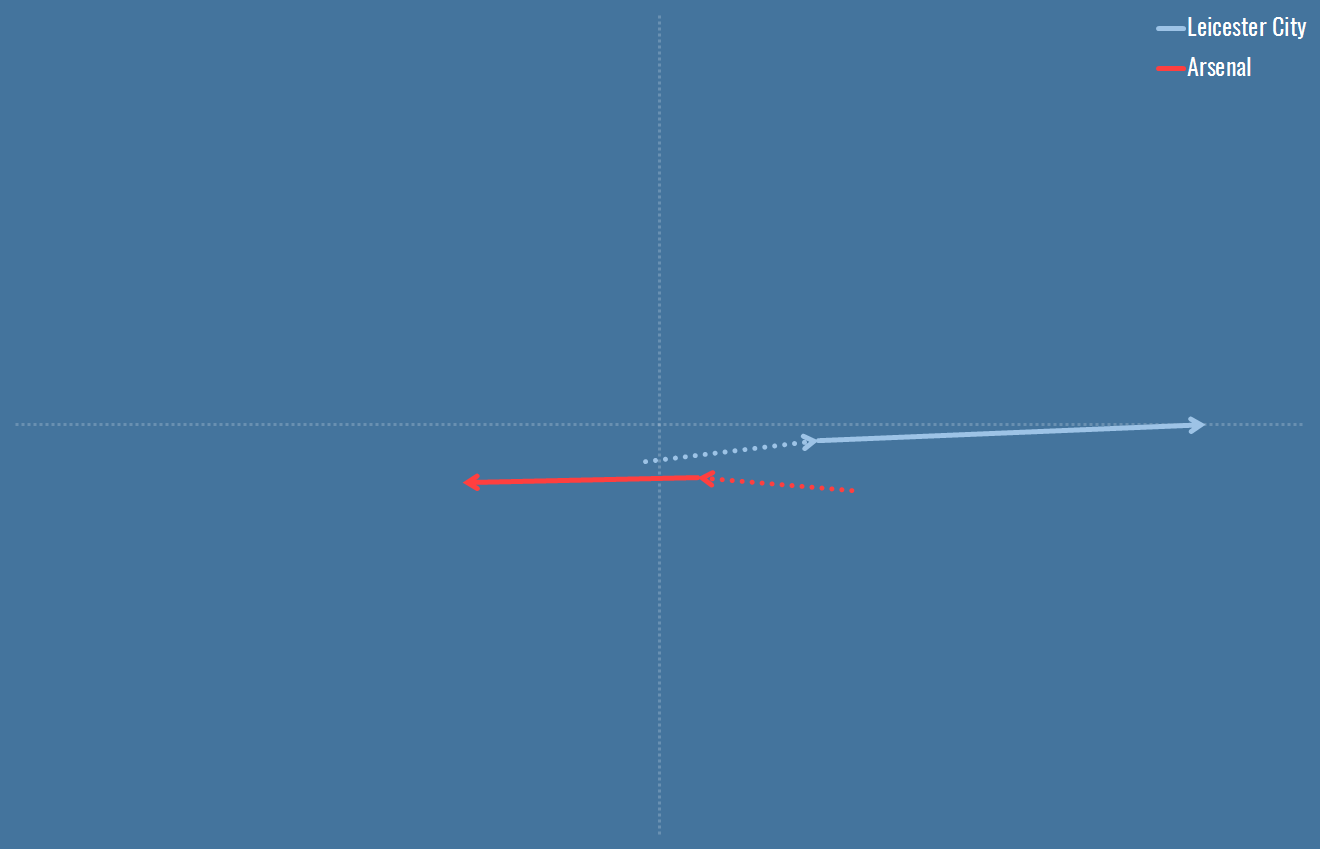
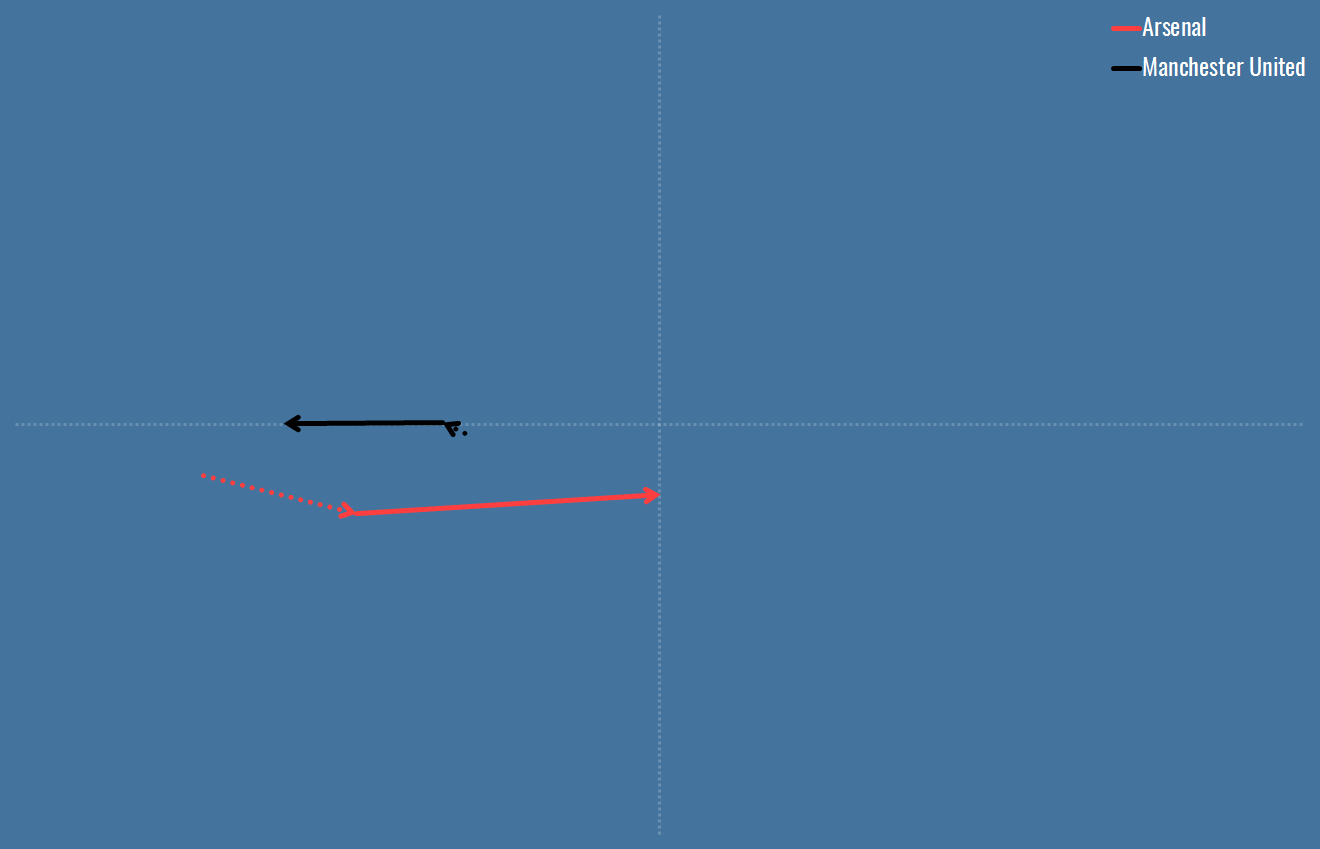
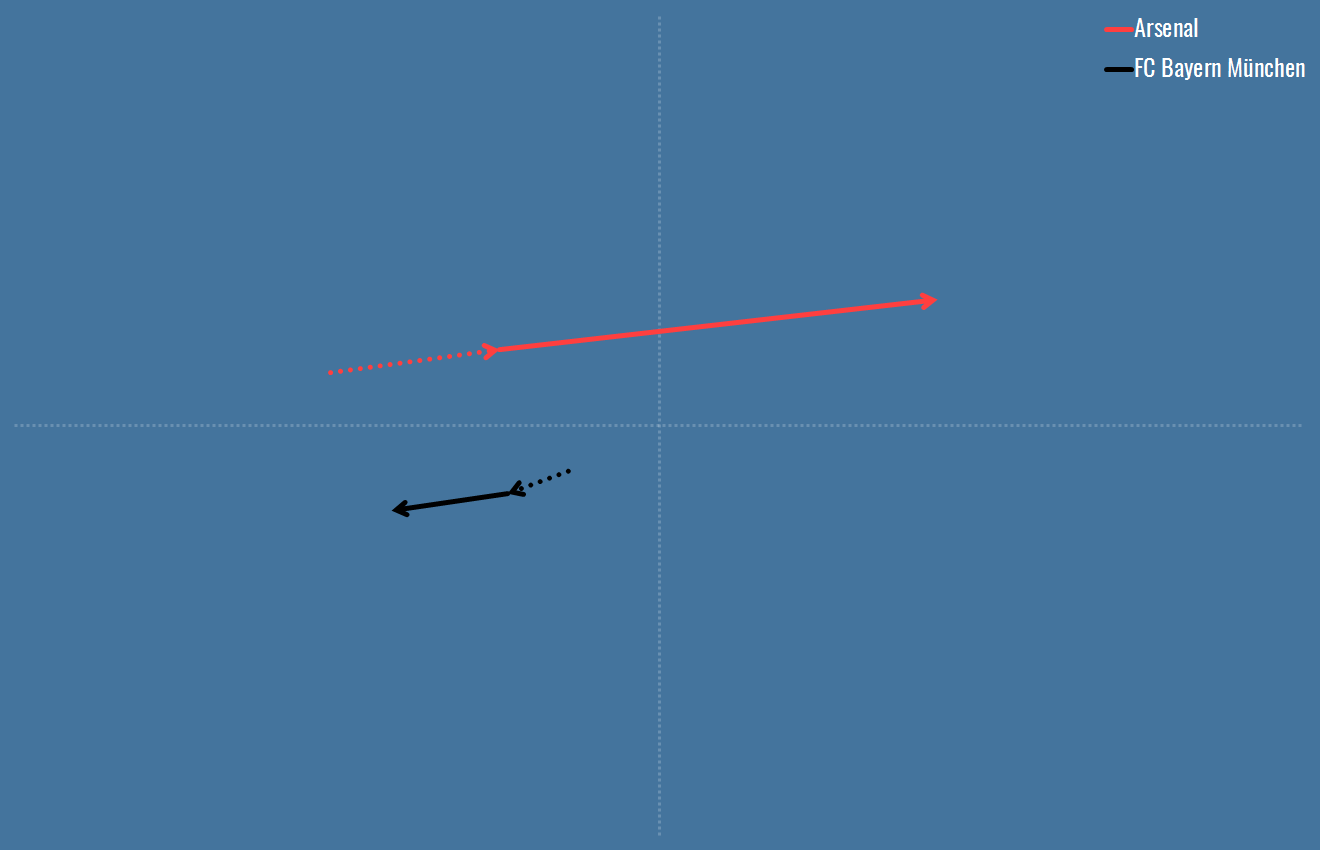
One player remains who can burn your xG calculations to worthless ash, the keeper. I think keeper performances are more complex than one-minus-xG, but ultimately you can use similar tools to work out a keepers expected saves as everything else. My expected saves model only measures shots that resulted in goals or saves (so technically includes some shots that may have been going wide), but takes into account all the variables a keeper might have to deal with – the origin of the shot, the type, the direction, the swerve. It’s worth pointing out that if you have a decent assist model, you can build the goalkeeper model for the other side of that – catches and punches cut out a certain xG worth of chances.

Variance

It would be remiss to conclude this piece without a nod to luck. It’s possible that luck is the single greatest factor in every shot, but it’s really only something we can measure in the aggregate. If a player scores a 0.25xG chance, that doesn’t necessarily mean they’re lucky – they may have done exactly what they wanted to do, and they did it perfectly. However if that player repeatedly scores 0.25xG chances, they’re either very good indeed, or more likely, lucky. But we can’t really tell for a shot in isolation, except for spitting on long-range shots, because that’s what stats are required to do to get their license.

Many Models

So there’s nothing ground-breaking here, I just think it’s nice to start with the whole thing taken apart, pieces on the floor, before we decide how to put it back together. My belief is that we can learn a lot form building several smaller models to capture different aspects of the pipeline I described above:

  1. Chance creation. I think the world needs a model that measures attacking work even if it doesn’t result in a shot. Dan Altman’s OptaPro Forum presentation is exactly the sort of thing I’m talking about. I also think it would be interesting to expand on this to look at striker positioning – where should a striker have been to optimise their team’s goal-scoring chances.
  2. Chance quality. I think this is a better name than expected goals, for roughly the same thing, but the ship has sailed. I’m also separating out the work the team does in creating shots, from the actual shot taken by the striker, because I think they describe different things.
  3. Shot execution. As above, the other half of existing xG models. Over and above the chance quality, how does the striker’s chosen shot affect the likelihood of a goal? Are they regularly increasing the likelihood, i.e. shooting well? Or decreasing by choosing or shooting badly?
  4. Save difficulty. This is close to shot execution, except that I would expect shot models to factor in off-target shots, whereas a save model would not.

I haven’t used the word ‘expected’ anywhere, because I think it does subtle things to your outlook that aren’t helpful. But I think creating these different models and using them in different situations might be helpful. I also think there is some interesting analysis to do in comparing the different outcomes of models for the same shot – a low quality chance becomes a high quality shot, or a high quality chance becomes an easy save etc etc. By combining and comparing the models explicitly this way, we describe a lot more than just glomming everything together into one model. Or at least that’s my hope!

Anatomy of a Shot

Goals Conceded Likelihood

Having generated some expected save numbers with my new model, I thought it’d be interesting to see who has been dodging their luck so far this season. So given each team’s shots against and average xS, it’s easy to simulate the likelihood that each team’s goals conceded should be where it is or better:

Team Shots Condeded xS Likelihood
Tottenham Hotspur 32 5 77% 22%
Arsenal 41 8 74% 24%
Crystal Palace 42 8 77% 34%
Manchester City 24 8 75% 87%
Manchester United 33 9 68% 36%
Swansea City 36 9 75% 57%
Liverpool 30 10 70% 72%
Watford 38 10 68% 30%
Stoke City 47 10 70% 12%
Everton 43 11 72% 44%
West Bromwich Albion 42 11 75% 66%
Southampton 27 13 64% 93%
West Ham United 47 14 66% 34%
Aston Villa 46 15 76% 92%
Leicester City 42 17 65% 83%
Bournemouth 35 17 59% 85%
Newcastle United 54 18 71% 81%
Sunderland 52 19 69% 84%
Chelsea 53 20 66% 77%
Norwich City 45 20 60% 79%

So of the teams with the tightest defences, only Man City can really be trusted so far. Further down, Everton are outperforming by a goal or so, and the West Ham number sticks out, especially given that they’re this season’s most popular football analytics whipping-boy. They’re actually only a couple of shots better off than they should be, but because they’re facing tougher shots, the distribution is wider:

west-ham-conceded

Near the other end of the spectrum, my model’s pretty confident that things aren’t going to get worse at Aston Villa – they’re currently four goals down from where they likely should be:

aston-villa-conceded

Goals Conceded Likelihood

Expected Saves

As part of a longer-term attempt to deconstruct expected goals into a variety of different, more granular and perhaps slightly more descriptive models, I’ve knocked together an expected save model today, and I thought I’d highlight some of the more interesting results out of it. Below is the data for this year’s Premier League, containing:

  • Total shots on target
  • Shots on target saved
  • Goals
  • Expected saves – the model’s prediction of how many SoT should have been kept out
  • Saves above expected – how a keeper’s actual numbers compare to their expected numbers
  • Difficulty – the average difficulty of shot the keeper faced (this is calculated as sum(1 - xs) / count(shots))
  • Rating – simply saves over expected saves to make it easier to compare keepers

I’ve ordered by saves above expected because it’s a more in your face than the rating.

Season Keeper Shots Saves Goals Expected Saves Saves Above Expected Average Difficulty Rating
2015 Jack Butland 47 37 10 32.76 4.24 30.30% 112.94%
2015 Alex McCarthy 34 29 5 26.28 2.72 22.70% 110.34%
2015 Petr Cech 41 33 8 30.49 2.51 25.63% 108.23%
2015 Hugo Lloris 31 26 5 23.80 2.20 23.24% 109.26%
2015 Heurelho Gomes 38 28 10 25.94 2.06 31.74% 107.94%
2015 Adrián San Miguel del Castillo 30 22 8 20.65 1.35 31.17% 106.53%
2015 Tim Howard 43 32 11 30.97 1.03 27.98% 103.32%
2015 David de Gea 23 17 6 16.05 0.95 30.22% 105.92%
2015 Darren Randolph 12 8 4 7.43 0.57 38.08% 107.67%
2015 Sergio Romero 10 7 3 6.47 0.53 35.33% 108.24%
2015 Thibaut Courtois 21 14 7 13.77 0.23 34.45% 101.71%
2015 Michel Vorm 1 1 0 0.86 0.14 14.06% 116.36%
2015 Kelvin Davis 7 5 2 4.87 0.13 30.43% 102.67%
2015 Lukasz Fabianski 36 27 9 26.91 0.09 25.26% 100.35%
2015 Carl Jenkinson 5 3 2 3.01 -0.01 39.79% 99.65%
2015 Joe Hart 16 12 4 12.18 -0.18 23.86% 98.50%
2015 Adam Federici 11 6 5 6.53 -0.53 40.67% 91.93%
2015 Boaz Myhill 42 31 11 31.61 -0.61 24.73% 98.06%
2015 Robert Elliot 5 3 2 3.81 -0.81 23.82% 78.76%
2015 Simon Mignolet 30 20 10 20.95 -0.95 30.17% 95.47%
2015 Wayne Hennessey 8 5 3 6.04 -1.04 24.48% 82.76%
2015 Tim Krul 49 33 16 34.61 -1.61 29.36% 95.34%
2015 Willy Caballero 8 4 4 5.74 -1.74 28.25% 69.69%
2015 Artur Boruc 24 12 12 14.03 -2.03 41.52% 85.50%
2015 John Ruddy 45 25 20 27.10 -2.10 39.79% 92.26%
2015 Asmir Begovic 32 19 13 21.21 -2.21 33.71% 89.57%
2015 Kasper Schmeichel 42 25 17 27.49 -2.49 34.55% 90.94%
2015 Costel Pantilimon 52 33 19 35.76 -2.76 31.22% 92.27%
2015 Maarten Stekelenburg 20 9 11 12.41 -3.41 37.95% 72.53%
2015 Brad Guzan 46 31 15 34.74 -3.74 24.48% 89.24%

Some brief observations:

  • It’ll be interesting to see who goes to Euro 2016 for England, Jack Butland and Alex McCarthy are both making a good case early in the season.
  • That said, Alex McCarthy has faced the easiest shots on average of any keeper in the league (save Michel Vorm, who has had only one save to make).
  • Hugo Lloris is performing above xS, but not so much that Tottenham’s 5 goals conceded is overly flattering. Lloris is another that’s right down there in the difficulty stakes, and it’ll be interesting to analyse over the coming weeks whether this is tame shot-making, or defensive organisation.
  • The Brad Guzan vs Marrten Stekelenburg comparison at the bottom is fascinating – imagine if Southampton allowed as many shots as Aston Villa.

It’s early in the season, and saves are easier to make than goals (I’m not saying goalkeepers are the bassists of football, just that they save more than they let in, and strikers miss more than they score), so as you’d expect, the model matches reality fairly well so far. We can see this if plot expected saves versus saves – above the line is good, below is bad, further to the top right are the leakiest defences, bottom left are mostly backup, although Darren Randolph and Sergio Romero seem to have done fine when called upon this year.

expected-saves

I’ll be keeping this updated through the season and I’ll surface anything interesting I find in the historical data or across Europe. In the meantime, please enjoy the consistently inconsistent Tim Howard:

Season Shots Saves Goals xS xSdiff Difficulty Rating
2010 141 97 44 99.48 -2.48 29.45% 97.51%
2011 133 94 39 93.39 0.61 29.78% 100.65%
2012 128 89 39 85.00 4.00 33.59% 104.71%
2013 152 115 37 109.83 5.17 27.74% 104.70%
2014 109 65 44 72.81 -7.81 33.20% 89.28%
2015 43 32 11 30.97 1.03 27.98% 103.32%
Expected Saves

The 100% Club

Newcastle’s Georginio Wijnaldum-inspired thrashing of Norwich at the weekend surfaced this tidbit:

6 – Newcastle United scored with all six of their shots on target. Unremitting.

— OptaJoe (@OptaJoe) October 18, 2015

Who are the other members of this 100% on-target conversion club (big-5 leagues, 2012 onwards)?

Date Home Away Shots On Target Penalty Goals Goals
2013‑09‑01 VfB Stuttgart 1899 Hoffenheim 13 6 0 6
2014‑10‑18 FC Bayern München SV Werder Bremen 10 6 1 6
2015‑10‑18 Newcastle United Norwich City 11 6 0 6
2013‑03‑30 Fortuna Düsseldorf Bayer 04 Leverkusen 15 5 1 5
2013‑04‑20 Hannover 96 FC Bayern München 14 5 0 5
2013‑08‑25 Atlético de Madrid Rayo Vallecano 14 5 0 5
2014‑09‑21 Leicester City Manchester United 15 5 2 5

And a whole bunch on 4 or fewer. Something of a Bundesliga speciality it appears, with Newcastle part of an exclusive club to do it without penalties. I had a really good Grexit/currency conversion/conversion rate joke, so I nearly included Costa Rica vs Greece from the last World Cup, as Costa Rica converted one normal time goal and all their penalties to join the 6/6 club, but that felt like cheating.

The 100% Club