There comes a time in your adolescence as a stats writer when your parents rudely awaken you in the middle of the night, bundle you into a car, and drop you in the middle of a dark forest with nothing but a sharp stick. “It’s time you made your own defensive metric,” they tell you before receding into the darkness. It is a rite of passage every statto must endure alone.
Frightened and cold, you look for shelter. xG, you think. I know xG, good old xG, I can use that for something! But others have been here before, the forest has been hunted barren. What about those bright green diagrams everyone claims to like, could I just use those? Carving numbers into trees with your trusty pointy stick, you get to work.
As anyone who follows this blog will know, I’m quite interested in space and how teams use it. Today I’m going to look at the territory claimed by defenders and I’m going to propose a metric based on the actions they allow within that territory. It’s just one metric, it’s not the be-all and end-all of measuring defenders or defences, but I think it’s vaguely interesting, and its opinion on a lot of defenders is defensible. It has some flaws that’ll probably be obvious to you, but I’ll mention them as we go.
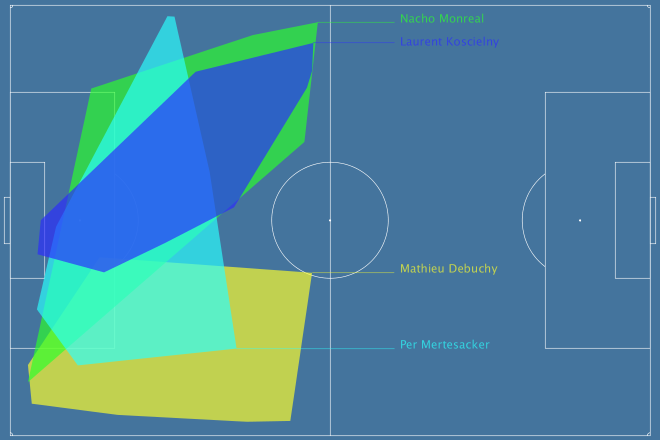
What does a defender’s territory look like? Here’s how Arsenal looked against Tottenham in the North-London derby:
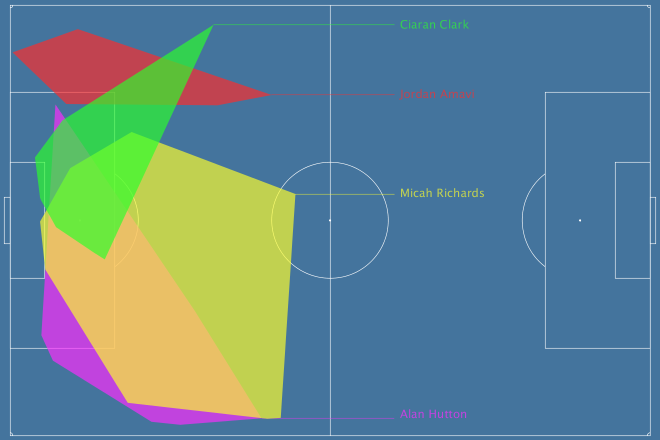
Here’s Aston Villa’s clean sheet against Manchester City:
And here’s Newcastle from their 1-0 smash and grab against Bournemouth:
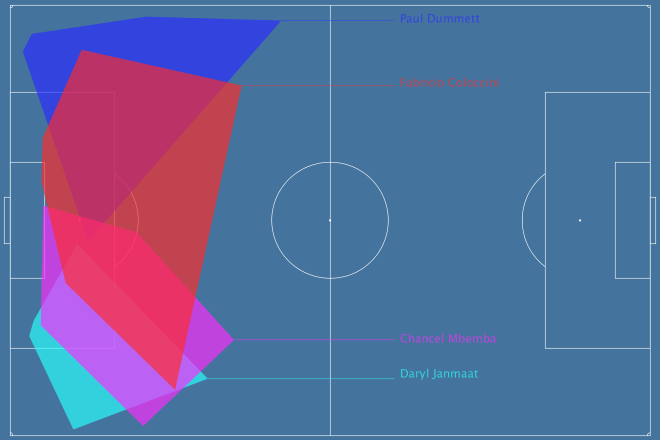
These are similar to my shot buildup charts, but for defensive actions. For each defender, we take all their own-half defensive actions (tackles, blocks, interceptions, clearances, aerial challenges and indeed fouls), and draw a line around them. This is their territory, it’s the part of the pitch they seem to want to be responsible for.
Now you could argue we could just split the final third of the pitch into four and assign each slice to a defender, but I think the overlaps are very valuable here – you want to know if a defender drifts inside or out, how far they push forwards etc. Obviously drawing the lines like this leaves gaps – nobody’s taking responsibility right at the edges or corners of the pitch. There’s also the problem of a player that makes a single tackle on the other side of the pitch, stretching their territory, perhaps unfairly. We could add a bit of a buffer zone to these areas, and trim some outliers, but for now I’m happy with them as they are – they are the best way we have of outlining a defender’s territory, based entirely on where the defender tries to defend.
Glancing at the charts above, you’ll notice some players have more territory than others. We want a metric that rewards this, if possible – if a player is bossing the entire danger zone, that’s great, even if you might prefer to see their team-mates step in. So our metric’s first ingredient is the surface area of a defender’s territory.
But the positioning on its own is meaningless, we want to know how much control they exert in that space. For this, we count the number of touches opponents take in the defender’s territory. These aren’t touches as you see them on TV, these are just all the aggregate events we see in the data – passes, dribbles, shots, all the stuff opponents want to do in our half. We have to be careful here to count points inside the territory, and only those that overlap the defender’s time on the pitch.
We combine these by dividing the area by the number of touches, then we weight things by possession and per-ninetify everything. What you should picture is the defender scent-marking their territory (I find it easiest to picture John Terry doing this, for some reason), and then every opposition action diluting that scent more and more. Larger territory will necessarily be exposed to more opposition actions, but good defenders will prevent and repel as much of this as possible. Players that make fewer defensive actions will have tiny territories, but can still score highly by keeping opponents out.
What’s nice about this particular metric is that it doesn’t force you to work out whether tackles or interceptions or aerials or whatever are more important, and it doesn’t require you to look at shots and xG (or expected assists etc). It captures defensive pressure in open play, which is where most defending happens.
So, recapping the algorithm:
Area ÷ Opposition Touches ÷ Possession ÷ Minutes Played × 90
I like to refer to this as ‘Possession-adjusted Territorial Control Held’, or PaTCH. I am not good at acronyms, please suggest more. In the meantime, which defenders have a good PaTCH?
| Player | Team | PaTCH |
|---|---|---|
| Gabriel Armando de Abreu | Arsenal | 596.2 |
| John Terry | Chelsea | 302.0 |
| Chris Smalling | Manchester United | 268.2 |
| Cedric Ricardo Alves Soares | Southampton | 265.4 |
| Nicolás Otamendi | Manchester City | 261.9 |
| Matteo Darmian | Manchester United | 256.7 |
| Sylvain Distin | Bournemouth | 255.1 |
| Eliaquim Mangala | Manchester City | 250.1 |
| Sebastian Prödl | Watford | 248.4 |
| Virgil van Dijk | Southampton | 238.4 |
| Mamadou Sakho | Liverpool | 237.2 |
| Joleon Lescott | Aston Villa | 233.2 |
| Allan-Roméo Nyom | Watford | 226.6 |
| Fabricio Coloccini | Newcastle United | 226.4 |
| Aleksandar Kolarov | Manchester City | 209.8 |
| Neil Taylor | Swansea City | 208.4 |
| Ashley Williams | Swansea City | 202.1 |
| Laurent Koscielny | Arsenal | 195.3 |
| Simon Francis | Bournemouth | 194.4 |
| César Azpilicueta | Chelsea | 189.2 |
| Luke Shaw | Manchester United | 187.7 |
| Kurt Zouma | Chelsea | 185.4 |
| Toby Alderweireld | Tottenham Hotspur | 185.0 |
| Ryan Bertrand | Southampton | 182.2 |
| Steven Whittaker | Norwich City | 176.8 |
| Gareth McAuley | West Bromwich Albion | 175.1 |
| Micah Richards | Aston Villa | 174.3 |
| Jose Fonte | Southampton | 171.8 |
| Russell Martin | Norwich City | 171.0 |
| Glen Johnson | Stoke City | 170.9 |
| Jeffrey Schlupp | Leicester City | 167.3 |
| Daley Blind | Manchester United | 163.9 |
| Bacary Sagna | Manchester City | 158.7 |
| Phil Jagielka | Everton | 158.4 |
| Nathaniel Clyne | Liverpool | 158.3 |
| Ciaran Clark | Aston Villa | 155.5 |
| Federico Fernandez | Swansea City | 150.3 |
| Sebastien Bassong | Norwich City | 148.9 |
| Vincent Kompany | Manchester City | 146.4 |
| Per Mertesacker | Arsenal | 146.0 |
| Martin Kelly | Crystal Palace | 145.1 |
| Nacho Monreal | Arsenal | 142.1 |
| Craig Cathcart | Watford | 139.9 |
| Joel Ward | Crystal Palace | 138.1 |
| Martin Skrtel | Liverpool | 138.0 |
| Charlie Daniels | Bournemouth | 135.7 |
| Ben Davies | Tottenham Hotspur | 135.2 |
| Joseph Gomez | Liverpool | 134.9 |
| Robbie Brady | Norwich City | 134.7 |
| Winston Reid | West Ham United | 132.8 |
| Jan Vertonghen | Tottenham Hotspur | 132.1 |
| Alan Hutton | Aston Villa | 131.9 |
| Jordan Amavi | Aston Villa | 128.6 |
| Aaron Cresswell | West Ham United | 128.4 |
| Maya Yoshida | Southampton | 127.4 |
| Tommy Elphick | Bournemouth | 126.6 |
| Héctor Bellerín | Arsenal | 119.5 |
| Philipp Wollscheid | Stoke City | 119.4 |
| Branislav Ivanovic | Chelsea | 117.8 |
| Kyle Walker | Tottenham Hotspur | 116.9 |
| Geoff Cameron | Stoke City | 116.8 |
| Erik Pieters | Stoke City | 116.0 |
| Carl Jenkinson | West Ham United | 115.7 |
| Gary Cahill | Chelsea | 114.5 |
| Marc Muniesa | Stoke City | 114.3 |
| Kyle Naughton | Swansea City | 111.3 |
| James Tomkins | West Ham United | 110.8 |
| Scott Dann | Crystal Palace | 107.7 |
| Steve Cook | Bournemouth | 107.0 |
| John Stones | Everton | 106.8 |
| Daryl Janmaat | Newcastle United | 104.4 |
| Jonny Evans | West Bromwich Albion | 103.7 |
| Chris Brunt | West Bromwich Albion | 103.1 |
| Ritchie de Laet | Leicester City | 103.1 |
| Danny Rose | Tottenham Hotspur | 100.0 |
| Wes Morgan | Leicester City | 97.4 |
| Robert Huth | Leicester City | 95.3 |
| Brendan Galloway | Everton | 95.0 |
| Dejan Lovren | Liverpool | 92.3 |
| Billy Jones | Sunderland | 90.7 |
| Nathan Aké | Watford | 90.2 |
| Pape Souaré | Crystal Palace | 85.4 |
| Seamus Coleman | Everton | 84.6 |
| Massadio Haidara | Newcastle United | 83.2 |
| John O’Shea | Sunderland | 82.7 |
| Younes Kaboul | Sunderland | 80.5 |
| Craig Dawson | West Bromwich Albion | 77.5 |
| Chancel Mbemba | Newcastle United | 74.0 |
| Damien Delaney | Crystal Palace | 70.1 |
| Sebastián Coates | Sunderland | 69.1 |
| Patrick van Aanholt | Sunderland | 68.4 |
| Brede Hangeland | Crystal Palace | 64.6 |
These are filtered for defenders with 450+ mins (all data from before Saturday’s games), and I’m calculating the average PaTCH over those games. Note: as usual, ballsed up a bit, the graphics show territory marked out in the defender’s own half, the numbers are actually calculated for territory in the final third. But it’s cool, cos comparing the two sets of numbers will make for an interesting article in a bit.
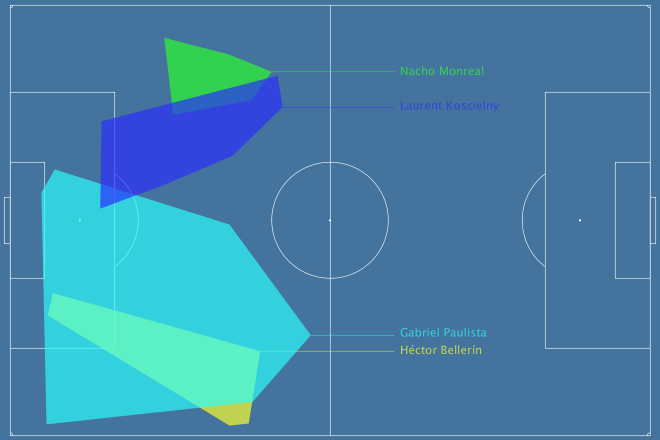
Gabriel is such an outlier because of Arsenal’s 1-0 win over Arsenal, in which Mitrovic got sent off and Newcastle had one shot. Look at the territory:
Now look at the heatmap from the BBC (Newcastle on the left):
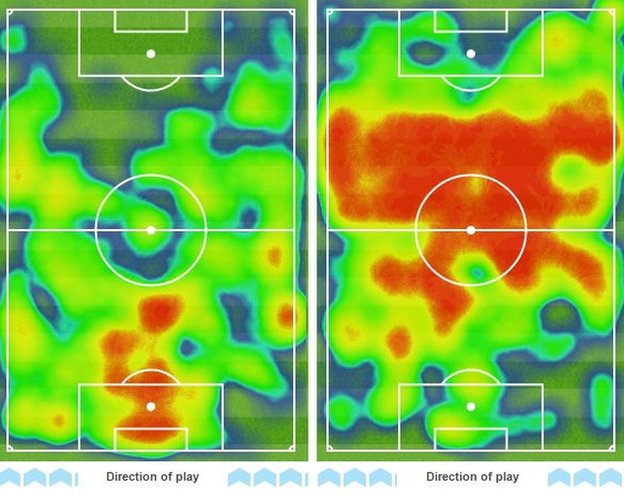
Newcastle had one touch in his territory, as far as I can tell, giving an astronomical match PaTCH (yup) in the three-thousands. Anyway, I will think of some better averaging or thresholding to reduce the impact of stuff like this, but still, he sort of earned it.
Elsewhere, you can see the model doesn’t like Sunderland or Crystal Palace much, but is a little bullish on Aston Villa’s defence. Of course this weekend Lescott was benched against Everton, and Villa decided to sit very deep and let Everton play, with horrific results. Everton themselves seem to have ridden their luck a few times – Galloway, Coleman and Stones bomb forward regularly and rely on Barry and McCarthy to pick up the slack in their territory, something I’d like to capture in the numbers at some point. Terry is still good at some stuff, Smalling’s number is consistent with the hype, Otamendi is predictably up there, and Koscielny is doing fine, though he’d probably benefit from that forever delayed defensive midfield signing for Arsenal. Lovren near the bottom, below every Liverpool and Southampton player.
For now, I’m reasonably happy with who shows up at the top and bottom. Over the next few days I’ll play with some historical data to tell some stories, incorporate this metric with a Christmas Shopping piece about defenders, then make some visualisations to see if there’s a good counterpart to the attacking buildup maps.

Nice analysis. Can you please post a download of all defenders so we can also look at the cumulative values for each team?
LikeLike
[…] there has recently been some good work done in this area by Thom Lawrence (https://deepxg.com/2015/11/22/defence-territory-and-control/, @deepxg on Twitter); Sam Gregory […]
LikeLike
I feel like this work has a lot of potential, but it has one flaw. It seems that when drawing the area around all actions made, actions made in unusual situations (like a tackle made after a cleared corner etc) will distort your shape. I would guess that a better picture of where a defender’s territory is could be defined more tightly, either by doing something like drawing the smallest possible regular shape around 90% of the defender’s actions, or just doing something simpler like excluding all actions of some distance away from all other actions.
LikeLike
I mentioned trimming outliers in the post, it’s something I’m definitely working on.
LikeLiked by 1 person
[…] while back I started looking at defence in terms of how a defender prevents their opponents operating in their territory. This included a metric called PATCH (“Possession Adjusted Territorial Control […]
LikeLike