Over the past couple of weeks, the 2016 State of the Stats survey gathered responses from more than 200 people involved in football analytics, either professionally or as a fan. This is the second year I’ve run the survey, and like last year, it’s about who we are as a community, our hopes and dreams, and the problems we face in our work. My hope is that it provides inspiration, tempers expectations, and exposes issues and opportunities for the coming year. At the very least, it’s got some big-ass pie charts in it, and that’s about as analytics as you can get, as I right?
Who Are We?
Affiliations
First up, it’s great to see that nearly half the people filling out the survey don’t necessarily identify as stats-first people:
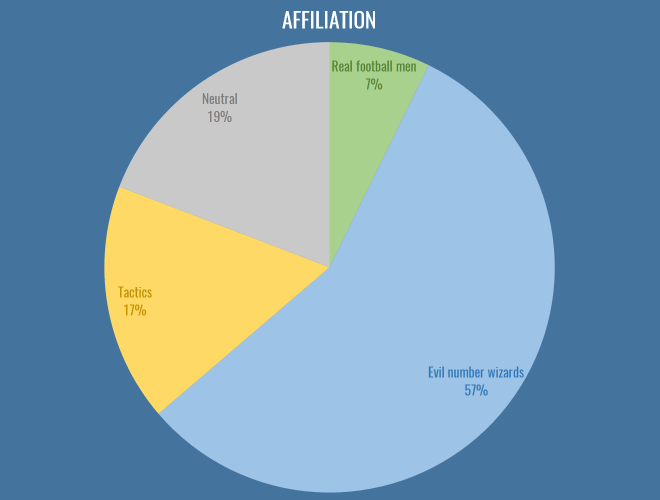
The first major issue I’d like to address here is that tactics people need to choose an appropriate epithet to describe them, along with ‘evil number wizards’ and ‘real football men’. I propose ‘The Pep Squad’, but I’m open to ideas. Nevertheless, this year has seen an interesting combination of cross-pollination and beef across the dividing lines of stats and tactics. Real football men hate laptops and Pep equally, so in a way provide us with some common ground, and the ascendancy of RB Leipzig has been a major driver in this regard: finally tactics and analytics people are united behind the common cause of destroying footballing traditions. Of course, stats people were trying to sign Naby Keita two years before you’d even created your first WordPress draft profiling him, but I wouldn’t know anything about that.
It is still the case that most analytics people view tactics writing as riddled with confirmation bias and small sample sizes, and tactics people view analytics people as missing almost everything interesting about football (e.g. basically every aspect of positional play, which is absolutely true). I maintain that the tactics community on Twitter and in the blogosphere is the single most unexploited resource for statsfolk. You have a group of smart people with fantastic intuition, who can help guide you to footballing truths and interesting patterns, and in return you can help add rigour and context to those intuitions. As an amateur analytics writer, you’re not going to get a better proxy for a manager or coach to drive your work. I hope to see more collaborations between the communities in 2017.
Ages
Once again, I neglected add in a question about the gender makeup of the analytics community, because I’m an arsehole, especially given this was pointed out last year. We go again. What we do have again this year is the age composition both inside and outside clubs:
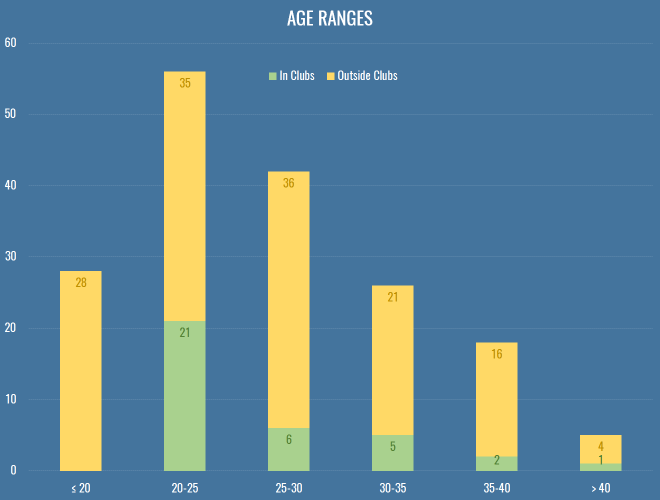
This is still very much skewed to the left, even more so for people at clubs or working as consultants. Without wanting to sound patronizing to my younger compatriots, a lot of this is that clubs have horrible pay structures (for all sorts of back room staff, forget about just stats). If you look at any of the analytics positions that get advertised publicly, you can sort of understand what someone with a mortgage and kids might not want to work the equivalent of two jobs for £20k, just because IT’S FOOTBALL! and IT’S A DREAM JOB! I was heartened to hear that the magnificent Christopher Long is soon to be entrusted with building the analytics team at an English club, and has stressed that he’s looking to pay market rate for technical positions. Hopefully that’s a sign of things to come.
Education
This is how we look in terms of education, comparing maths to sports science:
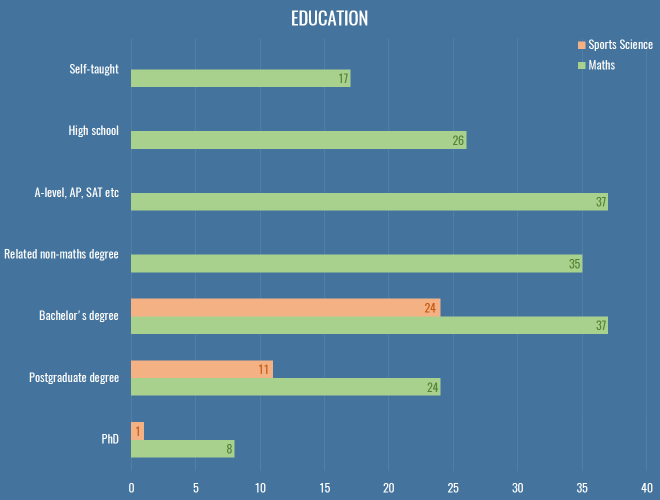
Of the roughly 40 respondents that work in clubs or as professional consultants, only two got there without at least a bachelor’s degree either in a mathsy or sports science subject.
We had about 40 respondents with a formal coaching qualification, including 3 UEFA A Licencees. What made me especially happy was to see these people reporting skills with R and Python, and beyond, making it clear that there’s an increasing expectation of data skills even in the traditional roles in the sport.
What do we do?
In case you’re looking for a niche to fill, here are the stats for different types of work people were engaged in in 2016:
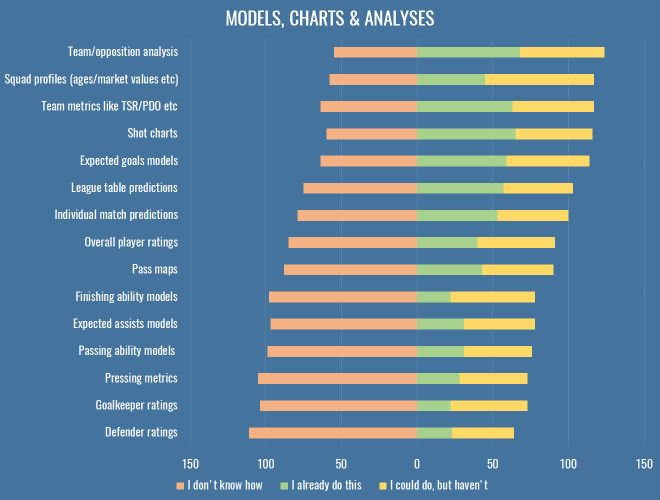
Once more, we find all the grubby stuff that has nothing to do with attacking at the bottom, which isn’t much of a surprise. If you’re working on attacking metrics in 2017, perhaps you might want to take a step back and see if your efforts could be better spent elsewhere. And if none of the above interest you, let’s have a trawl through the varied responses to the ‘Other’ option from this question:
- Evaluating crosses
- Evaluating counter-attacks
- Various time-in-possession measures
- Stability of possession
- Multitudes of non-shot models
- Measuring decision making
- Some version of WAR for football
- Cloning IMPECT/Packing
Here’s what people suggested you should work on in 2017:
- Simplifying and making actionable all your output
- Set piece analysis
- Treating events as sequences/networks
- Better GK metrics
- Studying transitions, identifying styles, the good, the bad
- A standardised definition of ‘possession’ for everybody to share and work from
- Measuring decision making
- Youth development
- Quantifying stats in monetary terms (e.g. for contract negotiations)
- Dribbling metrics
- Defence, goalkeepers, dear God anything but shots and xG
- Whatever increases a causal understanding of the sport
So, you can take all that to the bank.
Tools & Platforms
Here’s how we do what we do:
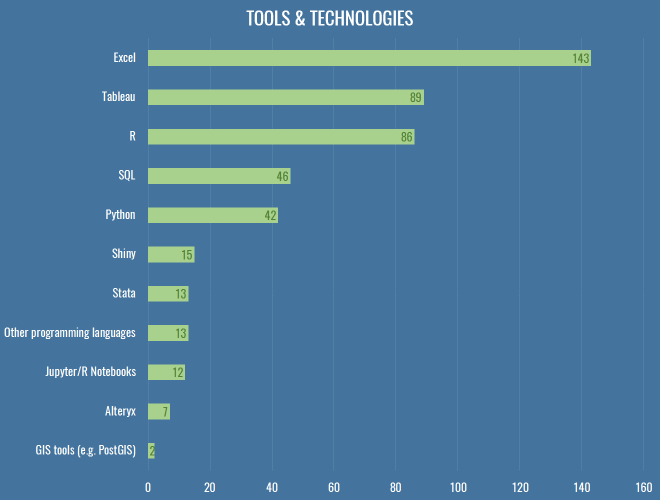
The geek in me wanted to get a bit more detailed this year, and find out who’s using GLMs versus random forests and stuff, but let’s be honest: a lot of analytics really is just swapping CSVs and scrolling around in Excel, which really explains why Tableau comes second here, being a slightly less painful version of that. People regularly ask me how to choose between R and Python, which annoys me because I had hoped Clojure would one day win, but its numerical computing suite (Incanter) has long since died. You should learn Python, all things being equal. R is great, and very productive in the first instance, with an enormous suite of maddeningly inconsistent libraries for almost anything you could stumble across on Wikipedia. You will have a long and happy career going from data, to slightly cleaner data, to ggplot2. But R is an atrocious general purpose language and runtime, has terrible error messages and documentation, and doesn’t have the depth of community that Python has in the wild. On top of that, distributed, GPU-based computing is going thriving more on Python than R, and as much football analytics is probably already going through the throes of well-reasoned-statistical-models versus wtf-black-box-deep-learning, the skills involved in the latter are going to prove hugely more valuable in industry over the next 10-20 years, and the bindings will appear on Python first, almost every time.
All that said, develop a brain and an eye for football first. There are people out there doing better work in Excel than you with your $20,000 of Amazon Web Services credit because they fundamentally know where to look better than you do.
In addition to these fundamental tools, almost a third of respondents used a video platform like WyScout or InStat. Not only are these essential parts of your recruitment and analysis pipelines within a club, they’re also hugely useful to confirm that things you’re seeing the data are actually real, or to find weird obscure bugs where possession chains last for ten minutes because someone had a head injury followed by a drop-ball.
What do we want?
Experience & Interests
We’re a disparate bunch, and it fills me with glee that something as simple as a bunch of spreadsheets can lead to so many different dreams and careers. Most of us are into stats because we feel it helps us understand the game better, but beyond that, we’re putting content out with the hope of one day getting paid, inside or outside the game.
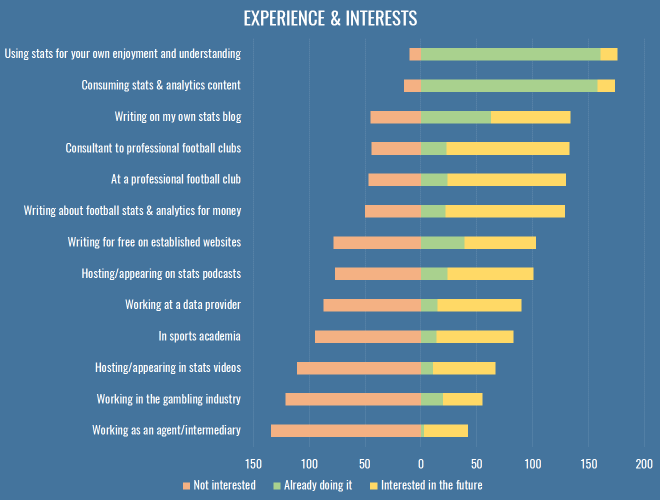
I added a couple of options this time just based on the different people I’ve met and chatted to over the last year, but it turns out not many people are interested in gambling or the intermediary business. I’ll let you all chase those £20k analytics jobs and £25-an-article writing gigs for a couple of years and then you can maybe re-examine the parts of the sports industry where the real money is, and where the edges really make a difference. ¯\_(ツ)_/¯
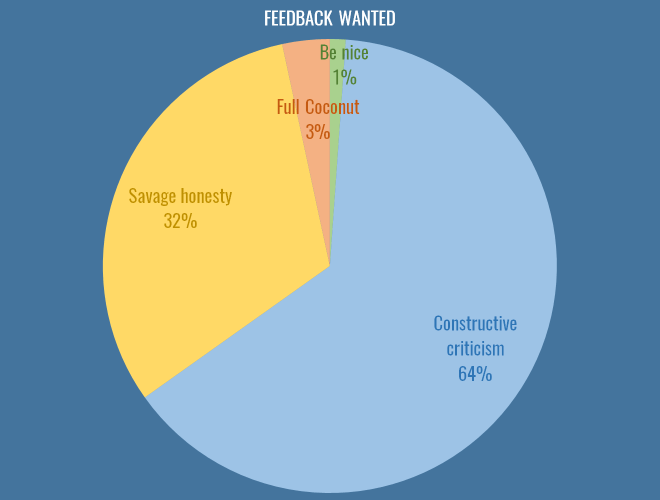
Feedback
An issue that bubbles up again and again on Twitter is how best to give feedback. It is an incredibly difficult and delicate issue, but here is how you responded:
I put this in for a variety of reasons, some of them personal. I must admit, when I first got into analytics (a little over a year ago, publicly), I produce some absolute dross. Misleading, badly thought out, dead-end crap. I got likes and retweets… precious #numbers on Twitter for those polygonal attacking charts, and numbers are the mind killer. You get addicted to the numbers. You feel validated by the numbers. Those charts were borne out of studying attacking buildup (possession chains, as the good doctor would have us call them). I truly believe the use of space and speed are absolutely central to attacking play, and they were one exploration of that, both on a football level of just seeing what different teams looked like, but on a technical level, of working out possession chains, and calculating convex hulls of possessions given their coordinates. These are incredibly valuable things for me, and I was incredibly grateful for both the kind words and the feedback I received. But let me be absolutely clear about those charts: they will never ever win anyone a football game. This dawned on me, and was also pointed out to me by people in the game, and I moved on (to other stuff that is also probably of dubious worth, but hey, it’s a process).
This is how the system should work, more or less efficiently. People need space to experiment with data, develop ideas, learn about the game, and test the waters of people’s interest inside and outside the professional game. And I’ll also point out here that stats as entertainment is also completely valid. Not everything needs to be aimed at professional clubs, or even winning statistical arguments. But I think as a community, we need to learn to draw that line extremely clearly. Because there is abysmal and colourful work out there that reveals nothing but the fact that its creator had some data and wanted to do something with it. There’s work that gets widely retweeted, that leads to more of the same, on a schedule, for every club and every game, and the numbers increase, but the ideas underlying the work stagnate. Nothing new is added, no assumptions are invalidated, nothing is tested against real games. One example this week of avoiding this cycle was Sander exploring some centrality measures from graph theory in his passing charts (already the most controversial visualisation in football analytics). I know some people haven’t worked out the mute buttons on their Twitter clients and post game viz can clog their timeline, but I’m at least impressed that he’s not just taking the retweets and sitting here. I hope we’ll all experiment with new metrics while still trying to relate them back to fundamental theories about the game of football.
At the same time, we have terrible communal memory about what’s been tried and found unhelpful before. Part of this is that we, grumpy and defensive about our work as we are, have managed to drive elder statesmen of the field like Dan Altman away (and he seems to be doing okay without Twitter). Dan’s intentions could be hard to fathom, he would judge other people’s work despite the details of his own being proprietary secrets, which often felt inequitable. But we should also be honest – all the people that responded above that they wanted to work professionally in clubs with analytics, every single one is competing with each other. For recognition, for prominence, so they can one day get one of those sweet £20k a year jobs. Despite all of that, most feedback, however vicious it might seem via the tone-deaf medium of Twitter, is coming from a place of statistical truth or practical football experience. Some of it is foul-mouthed, but I believe these people would still buy you a pint at the Opta Pro Forum.
If the above chart tells you anything, it’s that people want feedback on their work. They may not want the savage but artful trollistry of an anonymous coconut, but they want to learn, and get better. Sure, they want numbers too, and they need space to experiment, but I don’t believe were killing promising ideas in their cribs by pointing out flaws in nascent work.
Impediments
So, what’s stopping us doing better work? This is what people thought:
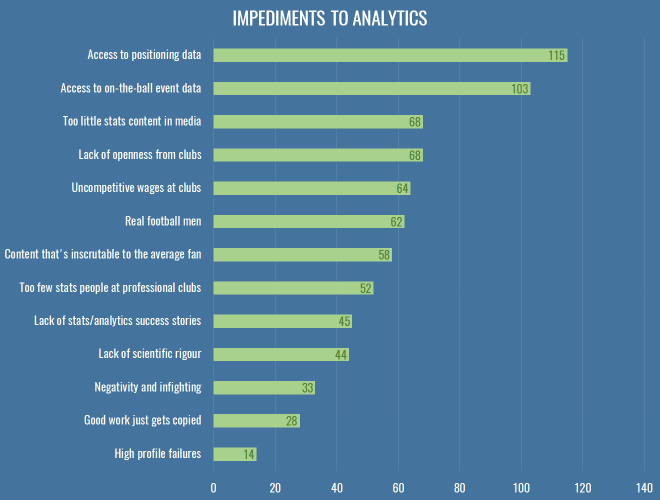
Everybody wants data. More data, better data. I was a bit sad to see ‘lack of scientific rigour’ down there, because it just means when we get all this data we’ll make a massive mess of it, thus Dr Marek Kwiatkowski’s seminal piece. But I stand by my comments that we need to play and explore before we make much progress.
THE BIT WHERE I GET YOU SOME FREE DATA
And so I bring good tidings: the nice people at Stratagem have a standing offer to anyone with a blog that wants to write about sports data:
As a company we are simply looking to increase the awareness of our unique dataset through partnerships with prolific and respected members of the analytics community. We have a team of over 50 performance analysts who have collected data on over 10,000 matches from 22 professional football competitions to date, with specific focus put upon on chance quality. We break scoring chances down into six categories and collect granular details such as number of players between the ball and goal, defensive pressure and shot quality. All matches since June 2016 come complete with XY coordinates on key events such as goals, chances and assists.
If you’d like some data to write an article and you’re happy attributing the source, you can contact Dave Willoughby directly, or head over to the Stratagem website to find out more about what they do.
On top of that, you can also join the efforts over at WoSo Stats, a community that gathers and analyses data about women’s soccer. I suspect they are always on the lookout for anyone who can help keep their hand-coded data up-to-date.
So, that is a step in the right direction, and nobody even mentioned the dark lord’s name. Aside from data, you’ll note that the option about club wages scored highly, whereas very few people chose the two ‘aggro’ options near the bottom – indicating once more that people really are looking for healthy debate and robust feedback of their work. I put in the question about copying work because it’s something I often hear grumbles about, but generally I think it’s entirely healthy for people to clone and (preferably) elaborate on others’ work, as long as some minimum amount of credit is given. If anything, I think we should be making it vastly easier to copy and replicate our work, which can only have a positive effect on the robustness of our conclusions.
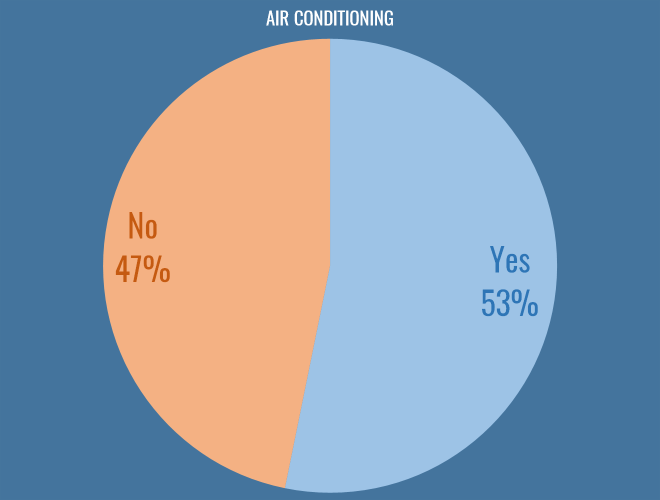
Air Conditioning
Possibly the most fundamental philosophical question facing us as football analysts today is whether or not you work in an air conditioned office. I am glad to say that the scales are tipping in favour of climate control, and I hope clubs continue to invest in this essential technology:
Conclusions
It’s been a funny year. With SmartOdds canning their analytics department it felt like the one organisation that really shouted about their use of stats had stepped back, damaging the field. As I hope some of these results show, the work still goes on elsewhere, just slightly more quietly.
For a while it seemed like there was a dearth of new work in the fanalytics community, with a lot of people having moved on from Twitter for professional or personal reasons. But towards the end of the year, there’s been a fantastic influx of new stuff. I don’t really want this to turn into a roundup of the best work in 2016, and I also don’t want to risk missing anybody out, but I feel going into the new year that there’s a strong cohort of active, prolific people shining a light in exactly the right areas.
Anyway, I promised myself I’d get this out in 2016, so if you’re looking for a rousing conclusion you’re out of luck. All I’ll say is that if you do even semi-good work in public, good things will happen to you, no matter how many crappy Sherwood memes you tweet to try and make yourself unemployable.

Great article!
As someone who has an interest in this area (as I can see how important it can become in football, especially as a football coach) but consider myself to not understand very much, what is the best way I can educate myself? I see so many articles but lack the understanding to engage I feel.
Happy new year
Louie
LikeLike
It’s certainly worth working back through the archive at http://statsbomb.com, you can sort of see how ideas develop. I’ve also built a search engine at http://apps.deepxg.com/search that you can use to look for interesting work on a wide variety of blogs. Search for “expected goals model” for example and you can see the work people have put our describing their models.
At some point you’ll want to start dabbling yourself, at which point you might want to find some data, build an SQL database, and learn Python, at which point really Google is your best friend. Some basic maths and statistics stuff from somewhere like the Khan academy is great if you feel the need to brush up on that.
LikeLike
[…] State of the Stats 2016 Results […]
LikeLike
Hi,
i’ve searched for tons of sites how to do scraping (w hosco red :)), but have no results at all.
VBA (Excel) doesn’t work properly as they prevent simple “GET” queries, so i assume it’s all up to python.
Are there any “ready-to-use” codes or other ways of scraping data?
LikeLike
[…] State of the Stats 2016 Results (December 31, Deep XG blog, Thom Lawrence) […]
LikeLike
[…] the New Year, I put together a survey inspired by something the soccer analytics community did last year. Thom Lawrence put it together and it was very […]
LikeLike