Idle Hands

“He’s had nothing to do all game,” we hear, every single week on Match of the Day, as if we’ve just cut to images of Hugo Lloris in a deck chair with a dog-eared copy of War and Peace, startled as a striker thunders by spilling his mojito.

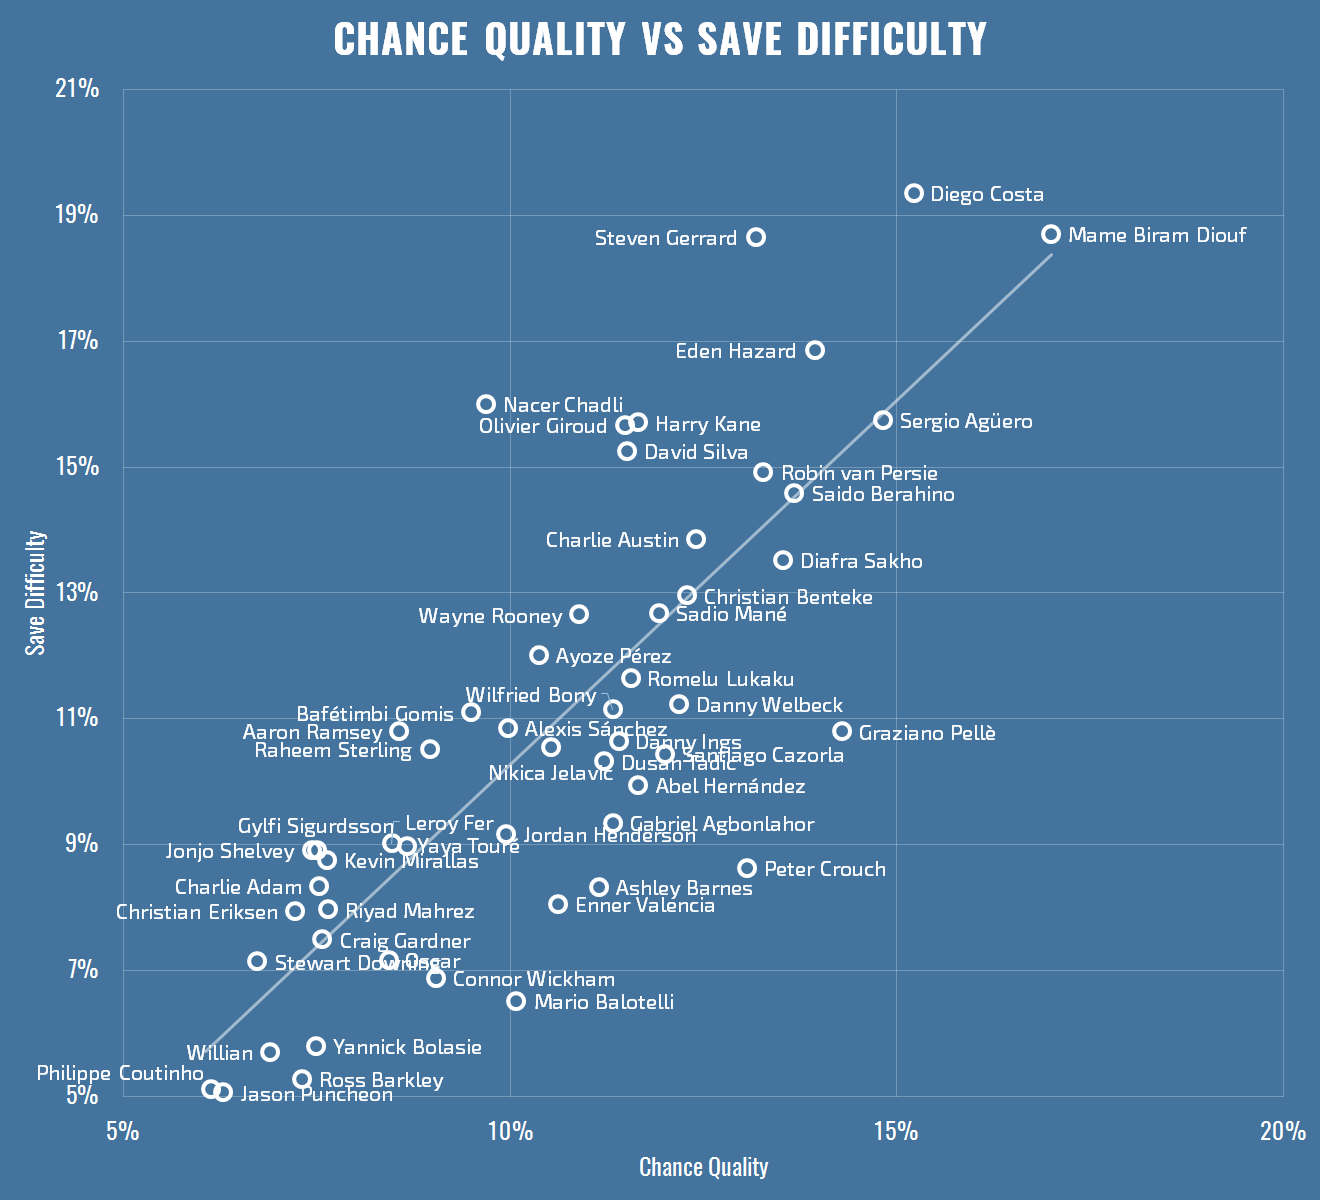
Do keepers really switch off when they’ve had nothing to do? I thought it would be simple enough to check, so I looked at all the shots I have on record in terms of my save difficulty metric.

Methodology

By working out the time between every shot on target faced and the previous goalkeeper event (be it another save, or a goal kick or whatever to wake the keeper out of their trance), you have the number of seconds the keeper has been idle before that shot. I limited the data to shots from open play, as you won’t have the element of surprise from dead-ball situations, and reset the clock at half time, so the maximum time a keeper can be idle is a little north of 45 * 60 = 2700 seconds.

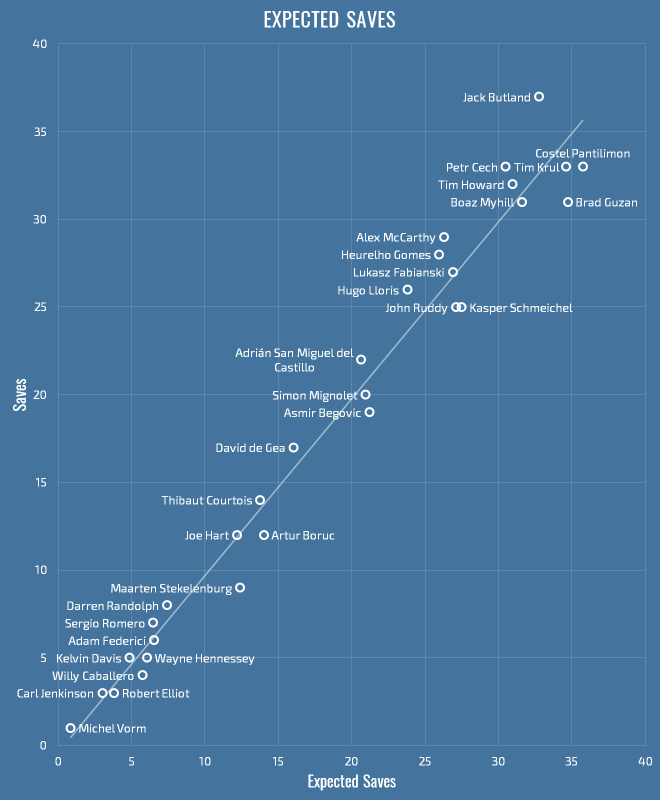
Then to measure keeper over- or under-performance, you can work out the saves above expected for that shot: if a shot has a save difficulty of 70%, we expect a statistically average keeper to only save it 30% of the time. So if they do save it, we’ll score that as 0.7 saves above expected – they got 1 whole save, we expected 0.3 saves (which obviously isn’t actually possible on a single shot, but you get the picture), so they got a profit of 0.7. If they don’t save it, they got a big fat zero saves, and we score it as -0.3.

So, we know for every shot whether the keeper over or under performed when attempting a save (to the extent you believe the outputs of an expected saves model, obviously), and we know how long they’ve been idle. Is there any interesting correlation here? Do higher numbers for idleness result in saves under the expected value?

Results

There is no overall correlation between idleness and shot stopping. I looked at the measure above, along with raw save percentage, with saves grouped into buckets by various lengths of idleness. The chart below shows the save percentage as the green area, and the saves above expected as the line.

idle-saves

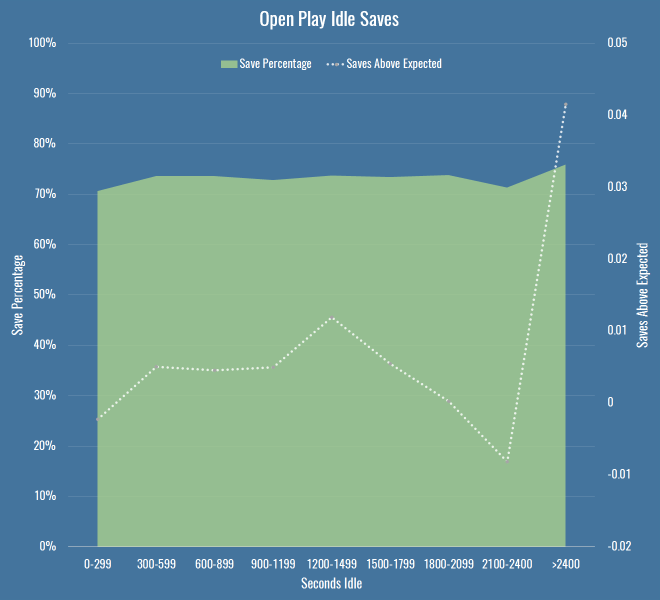
This shows basically nothing – the saves above expected values are tiny, and dwarfed by the error of any particular xG model you choose to use. You can also safely ignore the big jump towards the end of the half – the sample size is miniscule. So, keepers can rest easy against their goalposts?

On a hunch I filtered the data down to what Opta deem as ‘fast breaks’. If you’re going to catch an idle keeper off guard, maybe you just need to be quick about it. It’s a smallish dataset (just over 4000 shots) but behold this trend:

idle-saves-fast-break

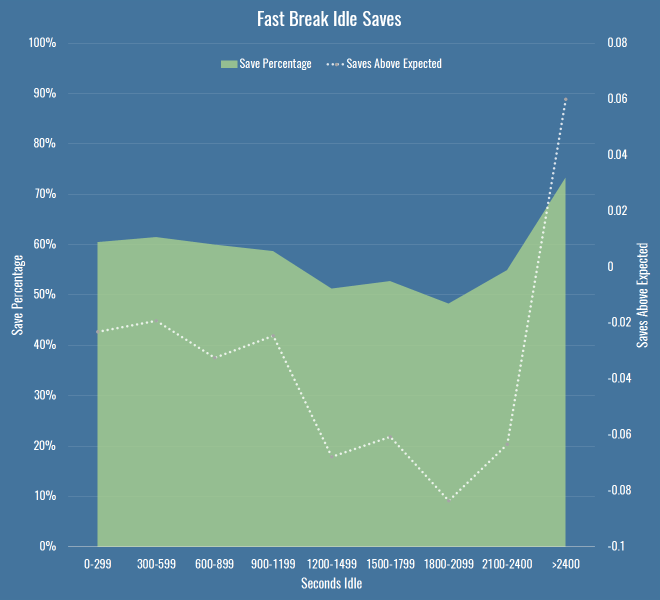
So there you go, have we found something? By the time we’re in that 1200-1499 second bucket, we’re talking 117 shots, with 72 in the next bucket, so again, small sample. I’ve also chosen the bucket size fairly arbitrarily – at 150 seconds per bucket, things are far more chaotic, and we should be wary of Simpson’s paradox when aggregating data. But it does seem to be a hint that maybe something’s going on. There’s at least a 10 percentage point drop in save percentage as idle time increases, and keepers are also saving fewer shots than we expect, which should account for any shot quality issues above and beyond raw save percentage.

Are we sure we have the right cause though? I checked if it was just that teams create better quality chances later into a half (encouraging teams on to them for the first half hour to create counter attacks, or probing and finding weaknesses, I dunno) but saw no real differences per minutes of the half. Then I thought that perhaps it’s nothing to do with keepers at all, maybe defences are the problem. So I created this chart – it shows the same save percentage area as above, but instead of saves over/under expected, I just put the average chance quality and the average save difficulty. This tells us how good the oppositions chances were, and how hard they were to save, regardless of how the keeper dealt with them.

fast-break-idle-xg
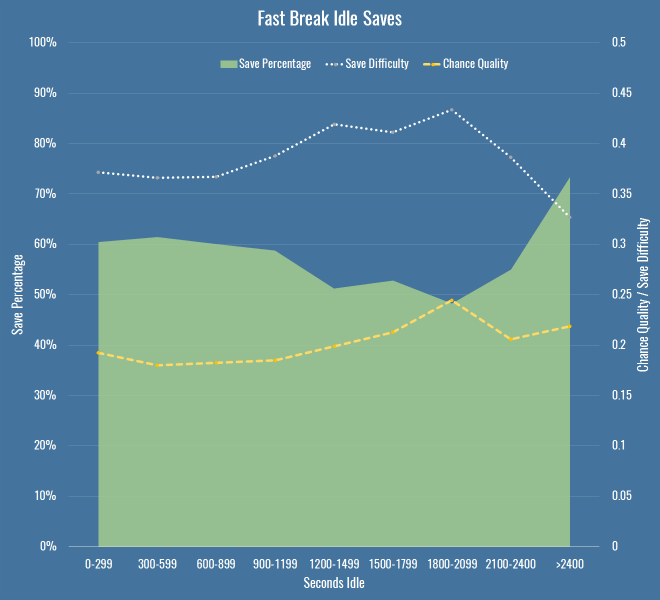
The important thing to note here is that my chance quality model includes almost nothing about the actual shot as taken by a striker – it’s mostly about the position of the shot, and the buildup to it. For that metric to be going up (again only slightly, and again with a small sample size) it’s entirely possible that the fault doesn’t only lie with idle keepers, but with idle defences too, for allowing better chances. It’s also possible that the under-performance of keepers in terms of expected saves (to the extent we believe it exists) is because we have no measure for defensive pressure.

So what do we know? If there is a decline in performance due to idleness, it’s small, hard to prove with confidence, and may in fact be due to defences and not keepers. Not very convincing, I’m sure you’ll agree, but I was recently reminded how important it was to publish low-significance and null results along with everything else (if only to ease the pressure on the wasteland that is my drafts folder). I also googled around a bit and found nothing mentioning this, so I thought it would be good to get it out there for posterity. At the very least, every time you hear the old cliché in commentary, you’ll know there’s probably little reason to worry that keepers who have been idle will suddenly forget to stop shots.

Caveats

A few notes and avenues for future work if you’re bothered:

  • By all means replicate this any way you like, it’s simple enough even if you have public shot data derived from the StatsZone app or BBC live text commentary. I’d be fascinated to hear if you find any patterns I’ve missed.
  • I’ve not looked at individual keepers – it’s possible there are some particular keepers that switch off, although I doubt it, and it’ll be a small sample size.
  • I didn’t include periods of extra time, just because I wanted to make sure that we were always comparing apple-shaped things.
  • I wasn’t strictly measuring idleness as time between saves, I was assuming that a catch or a goal kick was enough to wake a keeper up, but perhaps that’s an assumption to test.
  • I’m only looking at shot stopping, so I can’t rule out that idle keepers underperform on interceptions or catches in some way.
  • There are other measures one could use for fast breaks, or indeed counters, that may increase the sample size.
Idle Hands

Mid-Season Goalkeeper Review

Having descended into the quagmire of defensive metrics and never really returned, I thought it was about time to break my 2016 duck and publish something. Given that I occasionally spot people arguing in obscure forums pointing at the last iteration, I thought it was time to update my keeper ratings:

Keeper Mins Shots Saves Goals Save % Expected Saves ± Expected Average Difficulty Rating
Mark Bunn 188 6 5 1 83% 3.87 1.13 35.56 129.32
Fraser Forster 188 1 1 0 100% 0.86 0.14 14.45 116.89
Michel Vorm 94 1 1 0 100% 0.86 0.14 14.06 116.36
Karl Darlow 94 4 3 1 75% 2.62 0.38 34.53 114.56
Paulo Gazzaniga 187 11 8 3 73% 7.07 0.93 35.72 113.14
Alex McCarthy 565 34 29 5 85% 26.28 2.72 22.70 110.34
Sergio Romero 375 9 7 2 78% 6.47 0.53 28.14 108.24
Darren Randolph 286 12 8 4 67% 7.43 0.57 38.08 107.67
Adrián 1790 89 69 20 78% 64.11 4.89 27.96 107.62
Joe Hart 1871 60 46 14 77% 43.38 2.62 27.71 106.05
Hugo Lloris 1963 67 51 16 76% 48.10 2.90 28.20 106.02
Jack Butland 1972 100 78 22 78% 73.66 4.34 26.34 105.89
Declan Rudd 751 40 28 12 70% 26.51 1.49 33.73 105.63
Petr Cech 1967 86 68 18 79% 66.03 1.97 23.22 102.99
Kelvin Davis 95 7 5 2 71% 4.87 0.13 30.43 102.67
David de Gea 1591 64 46 18 72% 44.98 1.02 29.72 102.27
Heurelho Gomes 1948 83 60 23 72% 59.92 0.08 27.80 100.13
Thibaut Courtois 997 52 36 16 69% 35.99 0.01 30.79 100.03
Costel Pantilimon 1599 103 71 32 69% 71.01 -0.01 31.06 99.99
Kasper Schmeichel 2079 86 60 26 70% 60.21 -0.21 29.99 99.66
Artur Boruc 1604 62 38 24 61% 38.25 -0.25 38.31 99.35
Tim Howard 2069 107 75 32 70% 77.08 -2.08 27.96 97.30
John Ruddy 1316 63 38 25 60% 39.45 -1.45 37.37 96.31
Wayne Hennessey 1498 50 33 17 66% 34.45 -1.45 31.11 95.80
Tim Krul 754 49 33 16 67% 34.61 -1.61 29.36 95.34
Lukasz Fabianski 1979 85 56 29 66% 59.45 -3.45 30.06 94.19
Vito Mannone 376 23 15 8 65% 15.94 -0.94 30.69 94.09
Boaz Myhill 2077 92 63 29 68% 66.98 -3.98 27.19 94.05
Simon Mignolet 1889 65 42 23 65% 44.66 -2.66 31.29 94.04
Robert Elliot 1224 63 42 21 67% 44.82 -2.82 28.86 93.72
Willy Caballero 187 17 12 5 71% 12.83 -0.83 24.55 93.55
Asmir Begovic 1079 50 33 17 66% 35.75 -2.75 28.50 92.31
Brad Guzan 1897 99 64 35 65% 71.53 -7.53 27.75 89.48
Maarten Stekelenburg 1599 49 30 19 61% 34.38 -4.38 29.83 87.26
Jordan Pickford 93 11 7 4 64% 8.10 -1.10 26.40 86.47
Adam Federici 422 24 11 13 46% 13.16 -2.16 45.15 83.56
Adam Bogdan 93 5 2 3 40% 2.90 -0.90 42.03 69.00

So many narratives, so little time:

  • If only they’d dropped Guzan sooner – Bunn in his tiny sample has risen to the top of the class. Similarly, Southampton have finally got Forster back again and they too aren’t looking back.
  • Tim Howard isn’t that bad, get over it.
  • Petr Cech isn’t single-handedly winning Arsenal the title, get over it.
  • Jordan Pickford didn’t have the best of times deputising for Costel Pantilimon, the mathematical definition of the average goalkeeper.
  • Artur Boruc has slowly clawed his way back, and Bournemouth are no longer conceding every time their opponents so much as look at the ball.
  • Someone needs to rescue Alex McCarthy, he should have been going to the Euros this Summer.
  • Adrian is a pretty solid number 1 given the minutes under his belt.

Anyway, apologies for the wait. Lots of stuff I can’t talk about is going on behind the scenes, but there will be some cool stuff up here soon enough. Well, hopefully.

Mid-Season Goalkeeper Review

Christmas Shopping: Goalkeepers

The nights are getting longer up here in the Northern Hemisphere, and soon children will be donning their traditional transfer window jumpers and gathering around open fires to sing traditional transfer window songs. In preparation for the festive season, I’m going to think about teams with really obvious deficiencies, and work out what Santa’s elves might be able to fax over on deadline day to fix them.

We’re going to start with goalkeepers, because frankly it’s easiest to draw up a naughty list of of rubbish keepers using our expected saves model. Below is the list of all keepers that have on average underperformed in the last five seasons, i.e. they’ve made fewer saves than the expected saves model expected. The rating is simply saves over expected saves, times 100. 100 is a keeper that saved exactly what the model thought they should, over is good, under is bad.

An aside as an Everton fan: I am going to note here that the player just above this list, who only just scraped a rating of 100.1, is Tim Howard. I don’t believe he’s as bad as most Everton fans like to make out (he’s just above Joe Hart in this year’s ratings, basically in the middle of the pack), but those that want to play along can by all means picture my recommendations below as applying to Everton as well (or indeed whichever team you happen to support). Just note that whoever Everton might get in will be facing the second most shots of any keeper in the Premier League, and mistakes will be made.

Keeper Season
2010 2011 2012 2013 2014 2015 Avg
Simon Mignolet 99.3 101.5 107.7 96.6 98.2 93.3 99.4
Julian Speroni 103.1 95.1 99.1
Tom Heaton 98.7 98.7
Richard Kingson 98.7 98.7
Adam Federici 98.4 98.4
Ben Hamer 98.2 98.2
Ali Al-Habsi 102.2 100.2 92.1 98.2
Matthew Gilks 98.0 98.0
John Ruddy 100.4 100.1 98.3 92.9 97.9
Robert Elliot 92.3 97.6 102.9 97.6
Brad Friedel 94.4 101.7 96.4 97.5
Bradley Jones 97.4 97.4
Kasper Schmeichel 98.7 95.9 97.3
Costel Pantilimon 90.9 104.5 96.4 97.3
David Marshall 97.2 97.2
Paulo Gazzaniga 103.6 90.3 97.0
Tim Krul 87.2 101.2 99.7 101.0 95.4 95.3 96.6
Boaz Myhill 85.4 108.8 87.4 104.9 96.1 96.5
Thomas Sørensen 99.4 99.7 89.9 96.3
Steve Harper 97.4 87.0 96.4 104.5 96.3
Adam Bogdan 93.3 99.3 96.3
Mark Bunn 96.3 96.3
Marcus Hahnemann 96.2 96.2
Robert Green 97.2 91.6 99.9 96.2
Gerhard Tremmel 102.5 88.2 95.3
Wayne Hennessey 95.6 100.4 89.9 95.3
Anders Lindegaard 107.0 83.3 95.1
Brad Guzan 98.1 97.8 92.6 96.7 89.9 95.0
Joel Robles 92.5 96.0 94.3
Kelvin Davis 90.5 96.9 93.7
Paul Robinson 101.3 85.9 93.6
Artur Boruc 95.3 100.4 85.0 93.5
Scott Carson 93.1 93.1
Patrick Kenny 91.4 91.4
Allan McGregor 93.7 87.4 90.5
Maarten Stekelenburg 93.9 83.1 88.5
Dorus de Vries 85.8 85.8
Stuart Taylor 81.2 81.2

There are a few main things I want to note here:

  1. Southampton have terrible taste in keepers – Boruc, Davis, Stekelenburg, all generally underperforming expected saves. Fraser Forster may come good, but until then, Southampton’s overall organisation is covering up a lack of quality between the posts.
  2. Bournemouth are in real trouble – Boruc isn’t great (not shown here is his 3 mistakes leading to goals already this year), and Adam Federici hasn’t done much better, but he’s left off this table as he’s below the 10-save cutoff. On top of these fairly poor performances is the fact that the shots Bournemouth are allowing are far, far trickier than any other team in the league (0.42xg against Boruc, 0.48 against Federici, against a league average of about 0.3), so literally anyone in their goalmouth would struggle.
  3. Brad Guzan is the only keeper consistently, year after year, to underperform expected goals but keep his place. The 100-based ratings actually boost him up the table a bit – in terms of raw goals above/below expected, Guzan is last this year, last in 2013, and firmly bottom 6 every season he plays. That’s partly Aston Villa’s woeful defence, but I do not know how Guzan has kept his place for so long.

Of this year’s relegation candidates, Robert Elliot, standing in for Tim Krul at Newcastle, is the only keeper to be performing above expected saves, by a teeny 0.3 goal margin. Pantilimon at Sunderland is poor but not the worst, Bournemouth would probably benefit more from a defensive shakeup to reduce the quality of chances conceded, and I think that leaves Aston Villa as the prime candidates for an upgrade. I might argue in a future post that their defence needs patching (*cough* Alan Hutton *cough*), but they’re conceding chances with an average 0.25xg which isn’t terrible. Guzan, however, is four goals down on where he should be this season and if history’s anything to go by, he’s going to get continue leaking goals. This is the last five seasons in detail:

Season Mins Shots Saves Goals Save % Expected Saves +/- Expected Shot Difficulty Rating
2015/16 1134 58 39 19 67% 43.4 -4.4 25.2 89.9
2014/15 3201 148 101 47 68% 104.5 -3.5 29.4 96.7
2013/14 3570 167 110 57 66% 118.8 -8.8 28.9 92.6
2012/13 3385 174 114 60 66% 116.6 -2.6 33.0 97.8
2011/12 620 26 18 8 69% 18.3 -0.3 29.4 98.1

So it kinda goes without saying, looking at the historical data above, that Villa could have sorted this out over the Summer, or last year, or the year before. But we’re entering a hypothetical world here where teams might agree to sell their first-choice goalkeeper in the January window, and those keepers might agree to join a team at or near the bottom of the Premier League, plus or minus any sort of reaction that Remi Garde gets between now and then. Let’s assume that nobody is going to drop down from a team above Villa to help out, otherwise I’d probably just point at Jack Butland and be done with it. Villa have been bringing in youth over the Summer, so let’s look at keepers 25 and under in Europe, playing at teams not currently in European competition, with decent ratings from our model. Let’s just assume that Premier League TV money is enough to land one of these targets. Who’s out there?

Keeper Mins Shots Saves Goals Save % Expected Saves +/- Expected Shot Difficulty Rating
Timo Horn 4155 231 177 54 76.6% 165.2 11.8 28.1 107.2
Gerónimo Rulli 2922 133 93 40 69.9% 87.9 5.1 33.1 105.8
Julián 1491 101 75 26 74.3% 71.1 3.9 20.2 105.5
Loris Karius 6208 349 257 92 73.6% 244.8 12.2 29.6 105.0
Benjamin Lecomte 4968 246 178 68 72.4% 171.0 7.0 29.1 104.1
Alphonse Areola 4386 183 131 52 71.6% 126.3 4.7 33.2 103.7
Marco Sportiello 4881 269 197 72 73.2% 191.1 5.9 30.2 103.1
Mattia Perin 9428 548 388 160 70.8% 380.0 8.0 30.6 102.1
Nicola Leali 3587 195 135 60 69.2% 132.9 2.1 31.3 101.6
Oliver Baumann 10447 573 406 167 70.9% 404.9 1.1 29.2 100.3

I’ve snuck Alphonse Areola in here despite the fact that he’s on a season long loan, just because he is/was vaguely available in principle. Any of these players, dead or alive, would probably be an improvement, and it seems like the transfer rumour mill, and potentially even Villa’s scouts, are ahead of me, they’ve been linked with Mainz’s Karius, and indeed Timo Horn. I don’t have Championship data, or smaller foreign leagues, so I will rely on those of you with eyes to fill me in there.

It’s worth noting that perhaps these numbers miss important parts of a modern goalkeeper’s game: Paul Lambert certainly rated Guzan’s distribution, we ought to look into that. Here’s everybody’s overall passing numbers:

Keeper Passes Completed Ratio
Oliver Baumann 4898 3096 0.63
Timo Horn 1537 953 0.62
Loris Karius 2633 1560 0.59
Gerónimo Rulli 973 574 0.59
Marco Sportiello 1616 931 0.58
Alphonse Areola 1383 798 0.58
Nicola Leali 1122 651 0.58
Mattia Perin 3167 1839 0.58
Benjamin Lecomte 1690 939 0.56
Brad Guzan 4455 2450 0.55
Julián 473 234 0.49

And here’s everything over 40 yards:

Keeper Passes Completed Ratio
Gerónimo Rulli 666 295 0.44
Nicola Leali 779 337 0.43
Brad Guzan 3181 1319 0.41
Marco Sportiello 1034 417 0.40
Julián 370 149 0.40
Oliver Baumann 2592 940 0.36
Benjamin Lecomte 1064 378 0.36
Timo Horn 857 305 0.36
Loris Karius 1527 548 0.36
Alphonse Areola 836 290 0.35
Mattia Perin 1845 641 0.35

So Guzan has 5% over Timo Horn on long balls, take it or leave it.

It remains to be seen whether Aston Villa’s transfer window tree will be sheltering a Timo Horn-shaped present this holiday season – I nearly ran the numbers on January goalkeeper transfers to see if it happened that regularly – but I’ll leave that for the more enterprising of you. It’s possible these targets have been approached and Villa have neither the ambition nor the spending power to land any of them. All you can ask for in your letters to Lapland this year is that Remi Garde gets Villa’s Summer signings to gel into some sort of attacking unit, Jack Graelish stops being peak-Ross Barkley wasteful, and someone keeps putting their face in the way of the ball.

Christmas Shopping: Goalkeepers

In the Gaps Between Models

In my Anatomy of a Shot I hinted that we might measure different component parts of xG and compare them. That’s exactly what I’m going to do in this post – take what I call chance quality, a form of xG that includes positional data but excludes the shot itself, and compare it to my expected save value for that shot. Because think about what happens between those two measurements – the first model says, “in general, teams have such-and-such a chance of scoring from some sort of shot over here”, the second says “shit, did you see that? He must have a foot like a traction engine.

What comes between those two models? Well, something resembling finishing quality, or at least good decision making. Even if a player isn’t converting a ton of chances, if they’re reliable making shots more difficult to save, they’re shooting well. If they’re taking prime quality chances but making them easy to save, well, maybe that’s rubbish shooting. That’s the theory at least, what do the numbers look like? Here’s everyone with 20+ shots in the Premier League this year:

Player Shots On Target Goals SoTR Conv% Chance Quality Save Difficulty SD/CQ SD-CQ
Olivier Giroud 23 12 4 52.17% 17.39% 14.43% 20.57% 142.57% 6.14%
Juan Mata 20 7 3 35.00% 15.00% 9.86% 15.08% 153.01% 5.23%
Sergio Agüero 33 14 6 42.42% 18.18% 12.44% 17.64% 141.77% 5.20%
Bafétimbi Gomis 23 11 4 47.83% 17.39% 14.17% 17.06% 120.40% 2.89%
Harry Kane 33 12 2 36.36% 6.06% 9.43% 12.28% 130.20% 2.85%
Ross Barkley 28 9 2 32.14% 7.14% 5.30% 7.92% 149.30% 2.61%
Jamie Vardy 38 17 9 44.74% 23.68% 15.73% 17.96% 114.18% 2.23%
Sadio Mané 26 10 2 38.46% 7.69% 9.42% 11.65% 123.63% 2.23%
Yohan Cabaye 21 8 4 38.10% 19.05% 16.11% 17.99% 111.70% 1.88%
Romelu Lukaku 28 12 5 42.86% 17.86% 12.59% 13.46% 106.91% 0.87%
Riyad Mahrez 25 11 5 44.00% 20.00% 13.27% 13.70% 103.22% 0.43%
Theo Walcott 26 12 2 46.15% 7.69% 14.68% 15.09% 102.83% 0.42%
Odion Ighalo 26 9 5 34.62% 19.23% 9.56% 9.61% 100.49% 0.05%
Graziano Pellè 38 11 5 28.95% 13.16% 12.60% 12.33% 97.88% -0.27%
Alexis Sánchez 45 15 6 33.33% 13.33% 12.17% 11.39% 93.53% -0.79%
Memphis Depay 25 8 1 32.00% 4.00% 8.09% 7.13% 88.15% -0.96%
Diafra Sakho 29 10 3 34.48% 10.34% 13.32% 11.82% 88.76% -1.50%
Philippe Coutinho 39 11 1 28.21% 2.56% 7.23% 5.68% 78.63% -1.54%
Santiago Cazorla 20 7 0 35.00% 0.00% 6.92% 5.28% 76.24% -1.64%
Jonjo Shelvey 21 7 0 33.33% 0.00% 4.83% 2.92% 60.54% -1.90%
Gnegneri Yaya Touré 26 8 1 30.77% 3.85% 9.23% 6.49% 70.28% -2.74%
Rudy Gestede 22 7 3 31.82% 13.64% 10.96% 8.10% 73.97% -2.85%
Aaron Ramsey 27 8 1 29.63% 3.70% 10.09% 6.94% 68.81% -3.15%
Jason Puncheon 20 3 0 15.00% 0.00% 7.08% 1.74% 24.65% -5.33%
Troy Deeney 23 4 0 17.39% 0.00% 8.43% 1.62% 19.28% -6.80%

I should note that the save difficulty number here, because I want an aggregate over all their shots, counts off-target shots as a save difficulty on zero. The raw number obviously averages out roughly to the global conversion rate of on-target shots (around 30%). So, we can see some players increase the average difficulty of their shots for keepers, others make them easier. I’ve calculated both the ratio (i.e. Juan Mata increases his shots’ difficulty by 1.5x), and the difference, (i.e. Juan Mata increased his shot quality of around 10% to a save difficulty of around 15%).

cq-vs-sd

To the right are better chances, top the top are better shots. You can see examples like Olivier Giroud and Sergio Agüero, who are making already quite good chances even scarier, Ross Barkley’s making bad chances look very slightly more exciting, and Jason Puncheon and Troy Deeney just need to stop.

Let’s look at a bigger sample, here’s 2014, 50+ shots:

Player Shots On Target Goals SoTR Conv% Chance Quality Save Difficulty SD/CQ SD-CQ
Nacer Chadli 54 22 11 40.74% 20.37% 9.69% 16.00% 165.11% 6.31%
Steven Gerrard 55 22 10 40.00% 18.18% 13.18% 18.66% 141.62% 5.48%
Olivier Giroud 70 29 14 41.43% 20.00% 11.49% 15.67% 136.36% 4.18%
Diego Da Silva Costa 76 37 20 48.68% 26.32% 15.22% 19.36% 127.25% 4.15%
Harry Kane 113 48 22 42.48% 19.47% 11.65% 15.71% 134.87% 4.06%
David Silva 66 27 12 40.91% 18.18% 11.51% 15.26% 132.61% 3.75%
Eden Hazard 78 33 14 42.31% 17.95% 13.94% 16.87% 121.04% 2.93%
Aaron Ramsey 63 17 6 26.98% 9.52% 8.56% 10.81% 126.27% 2.25%
Wayne Rooney 79 27 12 34.18% 15.19% 10.89% 12.66% 116.25% 1.77%
Mame Biram Diouf 55 22 11 40.00% 20.00% 17.00% 18.71% 110.01% 1.70%
Robin van Persie 76 37 10 48.68% 13.16% 13.27% 14.92% 112.41% 1.65%
Ayoze Pérez Gutiérrez 61 24 7 39.34% 11.48% 10.37% 12.02% 115.85% 1.64%
Bafétimbi Gomis 69 24 7 34.78% 10.14% 9.50% 11.10% 116.76% 1.59%
Raheem Sterling 84 33 7 39.29% 8.33% 8.96% 10.52% 117.51% 1.57%
Jonjo Shelvey 63 20 4 31.75% 6.35% 7.44% 8.92% 119.87% 1.48%
Charlie Austin 130 53 18 40.77% 13.85% 12.41% 13.86% 111.67% 1.45%
Gylfi Sigurdsson 67 24 7 35.82% 10.45% 7.50% 8.91% 118.77% 1.41%
Kevin Mirallas 52 16 7 30.77% 13.46% 7.63% 8.76% 114.92% 1.14%
Sergio Agüero 148 62 26 41.89% 17.57% 14.82% 15.75% 106.32% 0.94%
Saido Berahino 86 37 14 43.02% 16.28% 13.67% 14.59% 106.71% 0.92%
Alexis Sánchez 121 49 16 40.50% 13.22% 9.97% 10.85% 108.90% 0.89%
Charlie Adam 62 17 7 27.42% 11.29% 7.53% 8.34% 110.69% 0.80%
Sadio Mané 60 25 10 41.67% 16.67% 11.93% 12.68% 106.30% 0.75%
Christian Eriksen 97 26 10 26.80% 10.31% 7.22% 7.94% 109.90% 0.71%
Christian Benteke 80 29 13 36.25% 16.25% 12.29% 12.96% 105.43% 0.67%
Leroy Fer 54 14 6 25.93% 11.11% 8.47% 9.02% 106.47% 0.55%
Stewart Downing 70 19 6 27.14% 8.57% 6.73% 7.14% 106.10% 0.41%
Riyad Mahrez 63 24 4 38.10% 6.35% 7.65% 7.97% 104.15% 0.32%
Gnegneri Yaya Touré 89 27 10 30.34% 11.24% 8.66% 8.98% 103.61% 0.31%
Romelu Lukaku 106 43 11 40.57% 10.38% 11.56% 11.65% 100.81% 0.09%
Nikica Jelavic 57 15 8 26.32% 14.04% 10.53% 10.55% 100.23% 0.02%
Diafra Sakho 66 22 10 33.33% 15.15% 13.53% 13.52% 99.97% -0.00%
Craig Gardner 56 18 3 32.14% 5.36% 7.57% 7.49% 99.01% -0.07%
Wilfried Bony 89 35 11 39.33% 12.36% 11.33% 11.15% 98.43% -0.18%
Danny Ings 97 33 11 34.02% 11.34% 11.41% 10.65% 93.35% -0.76%
Jordan Henderson 50 14 6 28.00% 12.00% 9.95% 9.17% 92.16% -0.78%
Dusan Tadic 53 21 4 39.62% 7.55% 11.21% 10.32% 92.10% -0.89%
Danny Welbeck 58 23 4 39.66% 6.90% 12.18% 11.24% 92.33% -0.93%
Philippe Coutinho 103 34 5 33.01% 4.85% 6.13% 5.11% 83.40% -1.02%
Willian Borges Da Silva 55 17 2 30.91% 3.64% 6.90% 5.70% 82.65% -1.20%
Jason Puncheon 65 20 6 30.77% 9.23% 6.28% 5.06% 80.63% -1.22%
Oscar dos Santos Emboaba Junior 72 23 6 31.94% 8.33% 8.43% 7.17% 85.05% -1.26%
Santiago Cazorla 93 33 7 35.48% 7.53% 12.00% 10.44% 87.04% -1.55%
Ángel Di María 61 18 3 29.51% 4.92% 6.06% 4.38% 72.26% -1.68%
Yannick Bolasie 69 19 4 27.54% 5.80% 7.49% 5.80% 77.43% -1.69%
Abel Hernández 52 19 4 36.54% 7.69% 11.66% 9.95% 85.33% -1.71%
Gabriel Agbonlahor 53 17 6 32.08% 11.32% 11.33% 9.34% 82.39% -2.00%
Ross Barkley 51 14 2 27.45% 3.92% 7.31% 5.27% 72.01% -2.05%
Connor Wickham 83 24 5 28.92% 6.02% 9.04% 6.88% 76.11% -2.16%
Enner Valencia 72 21 4 29.17% 5.56% 10.62% 8.05% 75.77% -2.57%
Ashley Barnes 66 21 5 31.82% 7.58% 11.15% 8.33% 74.71% -2.82%
Graziano Pellè 123 38 12 30.89% 9.76% 14.29% 10.80% 75.61% -3.49%
Mario Balotelli 56 20 1 35.71% 1.79% 10.08% 6.51% 64.60% -3.57%
Peter Crouch 59 17 8 28.81% 13.56% 13.07% 8.63% 65.99% -4.45%

Which in turn looks like this:

cq-vs-sd-2014

Steven Gerrard’s numbers here are padded a bit by penalties, but he took good penalties, so you can see the boost he gets. Costa was a monster, Nacer Chadli was incredibly sharp (though seems to have crashed hard this season, basically halving the xG on every shot). Ross Barkley’s chances were just as bad, but unlike this year, they didn’t go in. Jason Puncheon just needs to stop.

So this is fun, but is it really any more interesting than conversion rate et al? Let’s look at how predictive each season is of the next. I’ll limit it to full seasons, players with 50+ shots. Here’s how various metrics perform:

Metric R2
2011-2012 2012-2013 2013-2014
SoTR 0.1967 0.041 0.0215
Conversion 0.4299 0.1271 0.2224
Scoring % 0.1844 0.0228 0.0584
SD/SQ 0.2122 0.2436 0.1161
SD-SQ 0.3498 0.2729 0.0929

While it’s clear we haven’t found the holy gail of a strongly repeatable shooting metric, I still like our composite model. It has the benefit that as my chance quality and save difficulty models get better, these numbers may also improve, and I’ll be sure to look into that.

At the very least, I think the idea of having small, granular models, and looking at the gaps between them is an interesting way to find some new metrics and insights, and I’ll see what else I can find with a similar approach.

In the Gaps Between Models

Goals Conceded Likelihood

Having generated some expected save numbers with my new model, I thought it’d be interesting to see who has been dodging their luck so far this season. So given each team’s shots against and average xS, it’s easy to simulate the likelihood that each team’s goals conceded should be where it is or better:

Team Shots Condeded xS Likelihood
Tottenham Hotspur 32 5 77% 22%
Arsenal 41 8 74% 24%
Crystal Palace 42 8 77% 34%
Manchester City 24 8 75% 87%
Manchester United 33 9 68% 36%
Swansea City 36 9 75% 57%
Liverpool 30 10 70% 72%
Watford 38 10 68% 30%
Stoke City 47 10 70% 12%
Everton 43 11 72% 44%
West Bromwich Albion 42 11 75% 66%
Southampton 27 13 64% 93%
West Ham United 47 14 66% 34%
Aston Villa 46 15 76% 92%
Leicester City 42 17 65% 83%
Bournemouth 35 17 59% 85%
Newcastle United 54 18 71% 81%
Sunderland 52 19 69% 84%
Chelsea 53 20 66% 77%
Norwich City 45 20 60% 79%

So of the teams with the tightest defences, only Man City can really be trusted so far. Further down, Everton are outperforming by a goal or so, and the West Ham number sticks out, especially given that they’re this season’s most popular football analytics whipping-boy. They’re actually only a couple of shots better off than they should be, but because they’re facing tougher shots, the distribution is wider:

west-ham-conceded

Near the other end of the spectrum, my model’s pretty confident that things aren’t going to get worse at Aston Villa – they’re currently four goals down from where they likely should be:

aston-villa-conceded

Goals Conceded Likelihood

Expected Saves

As part of a longer-term attempt to deconstruct expected goals into a variety of different, more granular and perhaps slightly more descriptive models, I’ve knocked together an expected save model today, and I thought I’d highlight some of the more interesting results out of it. Below is the data for this year’s Premier League, containing:

  • Total shots on target
  • Shots on target saved
  • Goals
  • Expected saves – the model’s prediction of how many SoT should have been kept out
  • Saves above expected – how a keeper’s actual numbers compare to their expected numbers
  • Difficulty – the average difficulty of shot the keeper faced (this is calculated as sum(1 - xs) / count(shots))
  • Rating – simply saves over expected saves to make it easier to compare keepers

I’ve ordered by saves above expected because it’s a more in your face than the rating.

Season Keeper Shots Saves Goals Expected Saves Saves Above Expected Average Difficulty Rating
2015 Jack Butland 47 37 10 32.76 4.24 30.30% 112.94%
2015 Alex McCarthy 34 29 5 26.28 2.72 22.70% 110.34%
2015 Petr Cech 41 33 8 30.49 2.51 25.63% 108.23%
2015 Hugo Lloris 31 26 5 23.80 2.20 23.24% 109.26%
2015 Heurelho Gomes 38 28 10 25.94 2.06 31.74% 107.94%
2015 Adrián San Miguel del Castillo 30 22 8 20.65 1.35 31.17% 106.53%
2015 Tim Howard 43 32 11 30.97 1.03 27.98% 103.32%
2015 David de Gea 23 17 6 16.05 0.95 30.22% 105.92%
2015 Darren Randolph 12 8 4 7.43 0.57 38.08% 107.67%
2015 Sergio Romero 10 7 3 6.47 0.53 35.33% 108.24%
2015 Thibaut Courtois 21 14 7 13.77 0.23 34.45% 101.71%
2015 Michel Vorm 1 1 0 0.86 0.14 14.06% 116.36%
2015 Kelvin Davis 7 5 2 4.87 0.13 30.43% 102.67%
2015 Lukasz Fabianski 36 27 9 26.91 0.09 25.26% 100.35%
2015 Carl Jenkinson 5 3 2 3.01 -0.01 39.79% 99.65%
2015 Joe Hart 16 12 4 12.18 -0.18 23.86% 98.50%
2015 Adam Federici 11 6 5 6.53 -0.53 40.67% 91.93%
2015 Boaz Myhill 42 31 11 31.61 -0.61 24.73% 98.06%
2015 Robert Elliot 5 3 2 3.81 -0.81 23.82% 78.76%
2015 Simon Mignolet 30 20 10 20.95 -0.95 30.17% 95.47%
2015 Wayne Hennessey 8 5 3 6.04 -1.04 24.48% 82.76%
2015 Tim Krul 49 33 16 34.61 -1.61 29.36% 95.34%
2015 Willy Caballero 8 4 4 5.74 -1.74 28.25% 69.69%
2015 Artur Boruc 24 12 12 14.03 -2.03 41.52% 85.50%
2015 John Ruddy 45 25 20 27.10 -2.10 39.79% 92.26%
2015 Asmir Begovic 32 19 13 21.21 -2.21 33.71% 89.57%
2015 Kasper Schmeichel 42 25 17 27.49 -2.49 34.55% 90.94%
2015 Costel Pantilimon 52 33 19 35.76 -2.76 31.22% 92.27%
2015 Maarten Stekelenburg 20 9 11 12.41 -3.41 37.95% 72.53%
2015 Brad Guzan 46 31 15 34.74 -3.74 24.48% 89.24%

Some brief observations:

  • It’ll be interesting to see who goes to Euro 2016 for England, Jack Butland and Alex McCarthy are both making a good case early in the season.
  • That said, Alex McCarthy has faced the easiest shots on average of any keeper in the league (save Michel Vorm, who has had only one save to make).
  • Hugo Lloris is performing above xS, but not so much that Tottenham’s 5 goals conceded is overly flattering. Lloris is another that’s right down there in the difficulty stakes, and it’ll be interesting to analyse over the coming weeks whether this is tame shot-making, or defensive organisation.
  • The Brad Guzan vs Marrten Stekelenburg comparison at the bottom is fascinating – imagine if Southampton allowed as many shots as Aston Villa.

It’s early in the season, and saves are easier to make than goals (I’m not saying goalkeepers are the bassists of football, just that they save more than they let in, and strikers miss more than they score), so as you’d expect, the model matches reality fairly well so far. We can see this if plot expected saves versus saves – above the line is good, below is bad, further to the top right are the leakiest defences, bottom left are mostly backup, although Darren Randolph and Sergio Romero seem to have done fine when called upon this year.

expected-saves

I’ll be keeping this updated through the season and I’ll surface anything interesting I find in the historical data or across Europe. In the meantime, please enjoy the consistently inconsistent Tim Howard:

Season Shots Saves Goals xS xSdiff Difficulty Rating
2010 141 97 44 99.48 -2.48 29.45% 97.51%
2011 133 94 39 93.39 0.61 29.78% 100.65%
2012 128 89 39 85.00 4.00 33.59% 104.71%
2013 152 115 37 109.83 5.17 27.74% 104.70%
2014 109 65 44 72.81 -7.81 33.20% 89.28%
2015 43 32 11 30.97 1.03 27.98% 103.32%
Expected Saves