One of the numbers that stuck out to me when I calculated the data in Attacking, Fast and Slow, was the slow pace of Tottenham’s attack. We know Pochettino values winning the ball back high up the pitch and launching fast-paced counter-attacks, so why isn’t that clearer from the data? In the light of Jake Meador‘s piece today which had a few commenters quite rightly puzzling over my numbers, I thought I’d look deeper and work out where the bugs were in my approach, and how better to present the data so it captures the nuances in Tottenham’s attack.
First off, there were issues with my data, and I’ve added a note and updated numbers to the the last post. Luckily, most of my conclusions remain correct (and in fact the correlation of attack duration from year to year is even stronger in the fixed data), but one of the big movers are indeed Tottenham, who now reside in the bottom half for attack duration.
Let’s look in more detail at exactly how quick each team’s attacks are. Here I’ve broken attacks down into 5 second buckets up to 30s, and sorted by the 0-5s bucket:
| Team | 0-5s | 5-10s | 10-15s | 15-20s | 20-25s | 25-30s | 30s+ |
|---|---|---|---|---|---|---|---|
| Southampton | 47 | 22 | 20 | 13 | 10 | 4 | 28 |
| Tottenham Hotspur | 40 | 20 | 21 | 15 | 18 | 11 | 29 |
| Arsenal | 39 | 21 | 32 | 25 | 17 | 12 | 35 |
| Liverpool | 38 | 27 | 16 | 9 | 11 | 7 | 38 |
| Aston Villa | 34 | 17 | 9 | 7 | 8 | 5 | 23 |
| Leicester City | 34 | 30 | 28 | 21 | 8 | 2 | 20 |
| Norwich City | 33 | 23 | 12 | 16 | 13 | 7 | 29 |
| Crystal Palace | 33 | 21 | 19 | 13 | 9 | 4 | 17 |
| Manchester City | 33 | 24 | 30 | 16 | 14 | 13 | 48 |
| Bournemouth | 30 | 22 | 10 | 10 | 6 | 7 | 22 |
| Watford | 30 | 22 | 21 | 11 | 11 | 5 | 25 |
| Chelsea | 28 | 17 | 23 | 11 | 10 | 11 | 29 |
| West Bromwich Albion | 25 | 14 | 14 | 8 | 5 | 5 | 20 |
| West Ham United | 25 | 27 | 15 | 16 | 8 | 9 | 26 |
| Sunderland | 24 | 9 | 14 | 9 | 11 | 6 | 18 |
| Everton | 23 | 16 | 15 | 18 | 7 | 10 | 29 |
| Newcastle United | 19 | 23 | 14 | 10 | 7 | 9 | 23 |
| Swansea City | 18 | 26 | 8 | 17 | 15 | 8 | 32 |
| Stoke City | 16 | 14 | 15 | 6 | 14 | 6 | 20 |
| Manchester United | 16 | 14 | 10 | 8 | 9 | 34 |
And here’s what that looks like stacked up together:
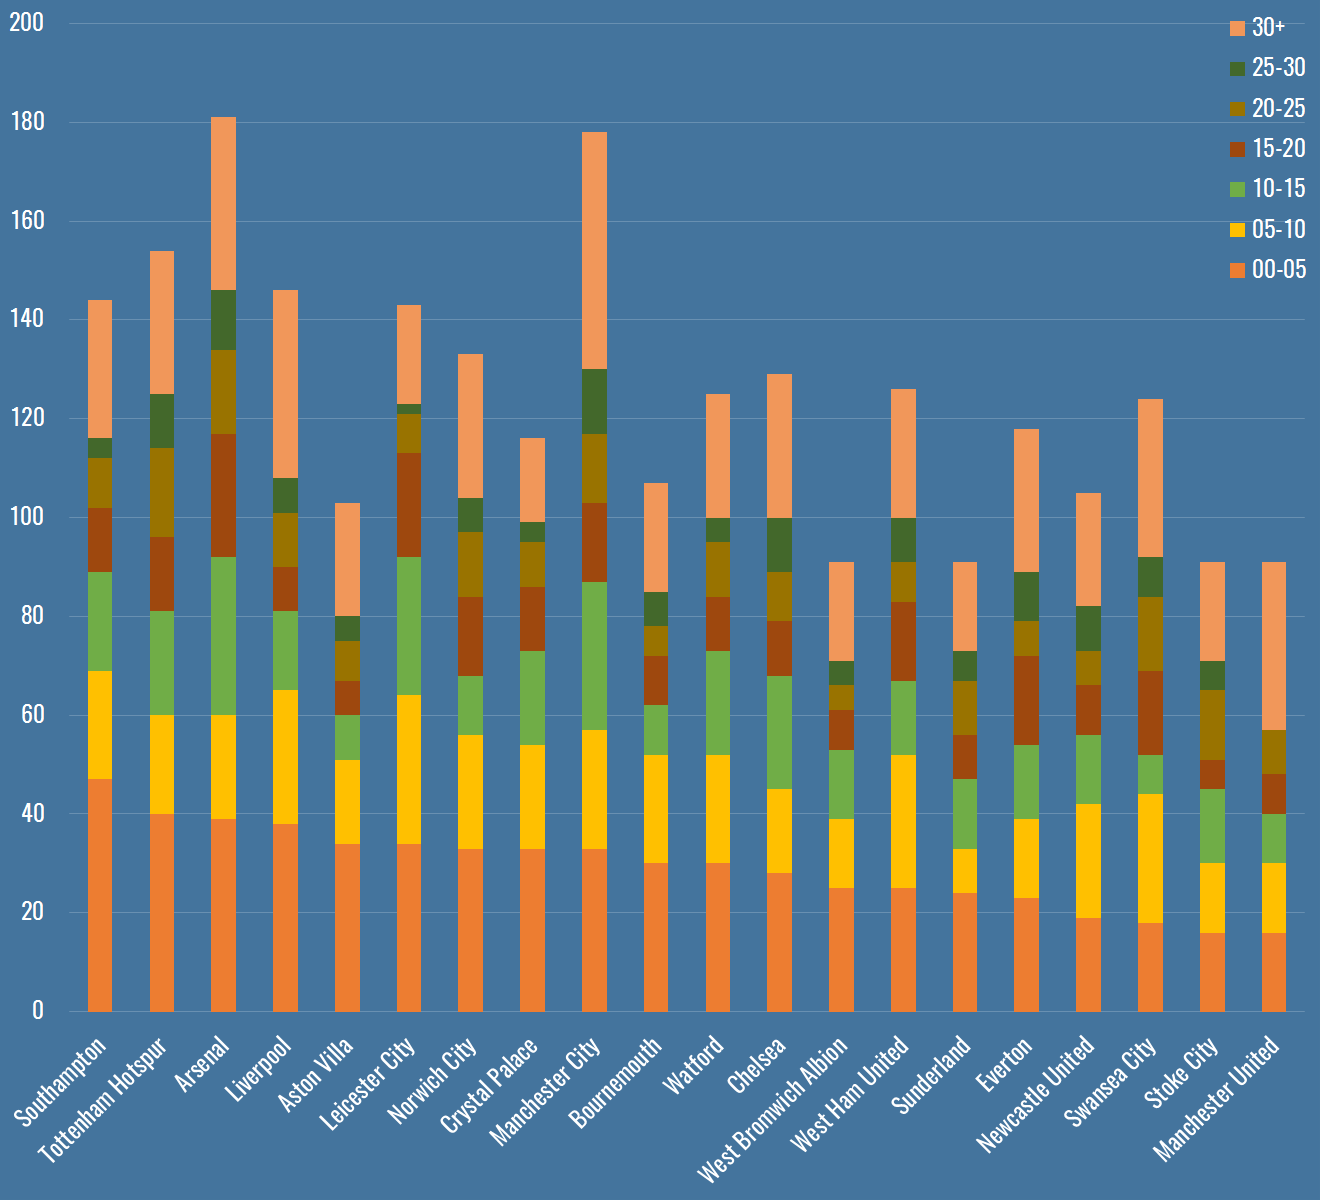
Well that matches our intuitions much better – the two teams we know share Pochettino’s desire for quick attacks off turnovers are right there are the top, with more shots within 5s than anyone else, and with 10s numbers that stack up pretty well too. I initially worried that these numbers might just be a side-effect of weird corner numbers, but Tottenham and Southampton sit 8th and 9th in corner count.
If you look at Tottenham’s numbers in the aggregate, they’re slowed down by patient build-up play. Despite the contrast in the chart above, they can be similar to Man Utd – moving the ball from side to side, waiting for an opportunity to open up. If you remember my passing gains chart, Tottenham’s passing on average in the centre of the field is backwards. They probe forwards on the wings, recycle backwards into the centre. Eventually this leads to shots that have taken a lot of time and space in the build-up, and I’ll certainly look for better ways to categorise this. But hopefully with the approach above, people are at least now seeing the Tottenham they know and love.
