In my Anatomy of a Shot I hinted that we might measure different component parts of xG and compare them. That’s exactly what I’m going to do in this post – take what I call chance quality, a form of xG that includes positional data but excludes the shot itself, and compare it to my expected save value for that shot. Because think about what happens between those two measurements – the first model says, “in general, teams have such-and-such a chance of scoring from some sort of shot over here”, the second says “shit, did you see that? He must have a foot like a traction engine.”
What comes between those two models? Well, something resembling finishing quality, or at least good decision making. Even if a player isn’t converting a ton of chances, if they’re reliable making shots more difficult to save, they’re shooting well. If they’re taking prime quality chances but making them easy to save, well, maybe that’s rubbish shooting. That’s the theory at least, what do the numbers look like? Here’s everyone with 20+ shots in the Premier League this year:
| Player | Shots | On Target | Goals | SoTR | Conv% | Chance Quality | Save Difficulty | SD/CQ | SD-CQ |
|---|---|---|---|---|---|---|---|---|---|
| Olivier Giroud | 23 | 12 | 4 | 52.17% | 17.39% | 14.43% | 20.57% | 142.57% | 6.14% |
| Juan Mata | 20 | 7 | 3 | 35.00% | 15.00% | 9.86% | 15.08% | 153.01% | 5.23% |
| Sergio Agüero | 33 | 14 | 6 | 42.42% | 18.18% | 12.44% | 17.64% | 141.77% | 5.20% |
| Bafétimbi Gomis | 23 | 11 | 4 | 47.83% | 17.39% | 14.17% | 17.06% | 120.40% | 2.89% |
| Harry Kane | 33 | 12 | 2 | 36.36% | 6.06% | 9.43% | 12.28% | 130.20% | 2.85% |
| Ross Barkley | 28 | 9 | 2 | 32.14% | 7.14% | 5.30% | 7.92% | 149.30% | 2.61% |
| Jamie Vardy | 38 | 17 | 9 | 44.74% | 23.68% | 15.73% | 17.96% | 114.18% | 2.23% |
| Sadio Mané | 26 | 10 | 2 | 38.46% | 7.69% | 9.42% | 11.65% | 123.63% | 2.23% |
| Yohan Cabaye | 21 | 8 | 4 | 38.10% | 19.05% | 16.11% | 17.99% | 111.70% | 1.88% |
| Romelu Lukaku | 28 | 12 | 5 | 42.86% | 17.86% | 12.59% | 13.46% | 106.91% | 0.87% |
| Riyad Mahrez | 25 | 11 | 5 | 44.00% | 20.00% | 13.27% | 13.70% | 103.22% | 0.43% |
| Theo Walcott | 26 | 12 | 2 | 46.15% | 7.69% | 14.68% | 15.09% | 102.83% | 0.42% |
| Odion Ighalo | 26 | 9 | 5 | 34.62% | 19.23% | 9.56% | 9.61% | 100.49% | 0.05% |
| Graziano Pellè | 38 | 11 | 5 | 28.95% | 13.16% | 12.60% | 12.33% | 97.88% | -0.27% |
| Alexis Sánchez | 45 | 15 | 6 | 33.33% | 13.33% | 12.17% | 11.39% | 93.53% | -0.79% |
| Memphis Depay | 25 | 8 | 1 | 32.00% | 4.00% | 8.09% | 7.13% | 88.15% | -0.96% |
| Diafra Sakho | 29 | 10 | 3 | 34.48% | 10.34% | 13.32% | 11.82% | 88.76% | -1.50% |
| Philippe Coutinho | 39 | 11 | 1 | 28.21% | 2.56% | 7.23% | 5.68% | 78.63% | -1.54% |
| Santiago Cazorla | 20 | 7 | 0 | 35.00% | 0.00% | 6.92% | 5.28% | 76.24% | -1.64% |
| Jonjo Shelvey | 21 | 7 | 0 | 33.33% | 0.00% | 4.83% | 2.92% | 60.54% | -1.90% |
| Gnegneri Yaya Touré | 26 | 8 | 1 | 30.77% | 3.85% | 9.23% | 6.49% | 70.28% | -2.74% |
| Rudy Gestede | 22 | 7 | 3 | 31.82% | 13.64% | 10.96% | 8.10% | 73.97% | -2.85% |
| Aaron Ramsey | 27 | 8 | 1 | 29.63% | 3.70% | 10.09% | 6.94% | 68.81% | -3.15% |
| Jason Puncheon | 20 | 3 | 0 | 15.00% | 0.00% | 7.08% | 1.74% | 24.65% | -5.33% |
| Troy Deeney | 23 | 4 | 0 | 17.39% | 0.00% | 8.43% | 1.62% | 19.28% | -6.80% |
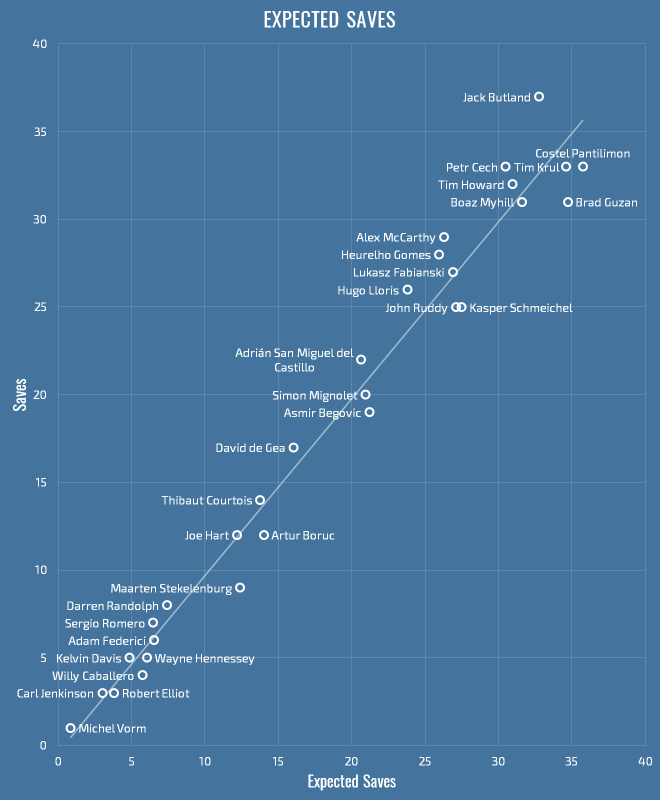
I should note that the save difficulty number here, because I want an aggregate over all their shots, counts off-target shots as a save difficulty on zero. The raw number obviously averages out roughly to the global conversion rate of on-target shots (around 30%). So, we can see some players increase the average difficulty of their shots for keepers, others make them easier. I’ve calculated both the ratio (i.e. Juan Mata increases his shots’ difficulty by 1.5x), and the difference, (i.e. Juan Mata increased his shot quality of around 10% to a save difficulty of around 15%).

To the right are better chances, top the top are better shots. You can see examples like Olivier Giroud and Sergio Agüero, who are making already quite good chances even scarier, Ross Barkley’s making bad chances look very slightly more exciting, and Jason Puncheon and Troy Deeney just need to stop.
Let’s look at a bigger sample, here’s 2014, 50+ shots:
| Player | Shots | On Target | Goals | SoTR | Conv% | Chance Quality | Save Difficulty | SD/CQ | SD-CQ |
|---|---|---|---|---|---|---|---|---|---|
| Nacer Chadli | 54 | 22 | 11 | 40.74% | 20.37% | 9.69% | 16.00% | 165.11% | 6.31% |
| Steven Gerrard | 55 | 22 | 10 | 40.00% | 18.18% | 13.18% | 18.66% | 141.62% | 5.48% |
| Olivier Giroud | 70 | 29 | 14 | 41.43% | 20.00% | 11.49% | 15.67% | 136.36% | 4.18% |
| Diego Da Silva Costa | 76 | 37 | 20 | 48.68% | 26.32% | 15.22% | 19.36% | 127.25% | 4.15% |
| Harry Kane | 113 | 48 | 22 | 42.48% | 19.47% | 11.65% | 15.71% | 134.87% | 4.06% |
| David Silva | 66 | 27 | 12 | 40.91% | 18.18% | 11.51% | 15.26% | 132.61% | 3.75% |
| Eden Hazard | 78 | 33 | 14 | 42.31% | 17.95% | 13.94% | 16.87% | 121.04% | 2.93% |
| Aaron Ramsey | 63 | 17 | 6 | 26.98% | 9.52% | 8.56% | 10.81% | 126.27% | 2.25% |
| Wayne Rooney | 79 | 27 | 12 | 34.18% | 15.19% | 10.89% | 12.66% | 116.25% | 1.77% |
| Mame Biram Diouf | 55 | 22 | 11 | 40.00% | 20.00% | 17.00% | 18.71% | 110.01% | 1.70% |
| Robin van Persie | 76 | 37 | 10 | 48.68% | 13.16% | 13.27% | 14.92% | 112.41% | 1.65% |
| Ayoze Pérez Gutiérrez | 61 | 24 | 7 | 39.34% | 11.48% | 10.37% | 12.02% | 115.85% | 1.64% |
| Bafétimbi Gomis | 69 | 24 | 7 | 34.78% | 10.14% | 9.50% | 11.10% | 116.76% | 1.59% |
| Raheem Sterling | 84 | 33 | 7 | 39.29% | 8.33% | 8.96% | 10.52% | 117.51% | 1.57% |
| Jonjo Shelvey | 63 | 20 | 4 | 31.75% | 6.35% | 7.44% | 8.92% | 119.87% | 1.48% |
| Charlie Austin | 130 | 53 | 18 | 40.77% | 13.85% | 12.41% | 13.86% | 111.67% | 1.45% |
| Gylfi Sigurdsson | 67 | 24 | 7 | 35.82% | 10.45% | 7.50% | 8.91% | 118.77% | 1.41% |
| Kevin Mirallas | 52 | 16 | 7 | 30.77% | 13.46% | 7.63% | 8.76% | 114.92% | 1.14% |
| Sergio Agüero | 148 | 62 | 26 | 41.89% | 17.57% | 14.82% | 15.75% | 106.32% | 0.94% |
| Saido Berahino | 86 | 37 | 14 | 43.02% | 16.28% | 13.67% | 14.59% | 106.71% | 0.92% |
| Alexis Sánchez | 121 | 49 | 16 | 40.50% | 13.22% | 9.97% | 10.85% | 108.90% | 0.89% |
| Charlie Adam | 62 | 17 | 7 | 27.42% | 11.29% | 7.53% | 8.34% | 110.69% | 0.80% |
| Sadio Mané | 60 | 25 | 10 | 41.67% | 16.67% | 11.93% | 12.68% | 106.30% | 0.75% |
| Christian Eriksen | 97 | 26 | 10 | 26.80% | 10.31% | 7.22% | 7.94% | 109.90% | 0.71% |
| Christian Benteke | 80 | 29 | 13 | 36.25% | 16.25% | 12.29% | 12.96% | 105.43% | 0.67% |
| Leroy Fer | 54 | 14 | 6 | 25.93% | 11.11% | 8.47% | 9.02% | 106.47% | 0.55% |
| Stewart Downing | 70 | 19 | 6 | 27.14% | 8.57% | 6.73% | 7.14% | 106.10% | 0.41% |
| Riyad Mahrez | 63 | 24 | 4 | 38.10% | 6.35% | 7.65% | 7.97% | 104.15% | 0.32% |
| Gnegneri Yaya Touré | 89 | 27 | 10 | 30.34% | 11.24% | 8.66% | 8.98% | 103.61% | 0.31% |
| Romelu Lukaku | 106 | 43 | 11 | 40.57% | 10.38% | 11.56% | 11.65% | 100.81% | 0.09% |
| Nikica Jelavic | 57 | 15 | 8 | 26.32% | 14.04% | 10.53% | 10.55% | 100.23% | 0.02% |
| Diafra Sakho | 66 | 22 | 10 | 33.33% | 15.15% | 13.53% | 13.52% | 99.97% | -0.00% |
| Craig Gardner | 56 | 18 | 3 | 32.14% | 5.36% | 7.57% | 7.49% | 99.01% | -0.07% |
| Wilfried Bony | 89 | 35 | 11 | 39.33% | 12.36% | 11.33% | 11.15% | 98.43% | -0.18% |
| Danny Ings | 97 | 33 | 11 | 34.02% | 11.34% | 11.41% | 10.65% | 93.35% | -0.76% |
| Jordan Henderson | 50 | 14 | 6 | 28.00% | 12.00% | 9.95% | 9.17% | 92.16% | -0.78% |
| Dusan Tadic | 53 | 21 | 4 | 39.62% | 7.55% | 11.21% | 10.32% | 92.10% | -0.89% |
| Danny Welbeck | 58 | 23 | 4 | 39.66% | 6.90% | 12.18% | 11.24% | 92.33% | -0.93% |
| Philippe Coutinho | 103 | 34 | 5 | 33.01% | 4.85% | 6.13% | 5.11% | 83.40% | -1.02% |
| Willian Borges Da Silva | 55 | 17 | 2 | 30.91% | 3.64% | 6.90% | 5.70% | 82.65% | -1.20% |
| Jason Puncheon | 65 | 20 | 6 | 30.77% | 9.23% | 6.28% | 5.06% | 80.63% | -1.22% |
| Oscar dos Santos Emboaba Junior | 72 | 23 | 6 | 31.94% | 8.33% | 8.43% | 7.17% | 85.05% | -1.26% |
| Santiago Cazorla | 93 | 33 | 7 | 35.48% | 7.53% | 12.00% | 10.44% | 87.04% | -1.55% |
| Ángel Di María | 61 | 18 | 3 | 29.51% | 4.92% | 6.06% | 4.38% | 72.26% | -1.68% |
| Yannick Bolasie | 69 | 19 | 4 | 27.54% | 5.80% | 7.49% | 5.80% | 77.43% | -1.69% |
| Abel Hernández | 52 | 19 | 4 | 36.54% | 7.69% | 11.66% | 9.95% | 85.33% | -1.71% |
| Gabriel Agbonlahor | 53 | 17 | 6 | 32.08% | 11.32% | 11.33% | 9.34% | 82.39% | -2.00% |
| Ross Barkley | 51 | 14 | 2 | 27.45% | 3.92% | 7.31% | 5.27% | 72.01% | -2.05% |
| Connor Wickham | 83 | 24 | 5 | 28.92% | 6.02% | 9.04% | 6.88% | 76.11% | -2.16% |
| Enner Valencia | 72 | 21 | 4 | 29.17% | 5.56% | 10.62% | 8.05% | 75.77% | -2.57% |
| Ashley Barnes | 66 | 21 | 5 | 31.82% | 7.58% | 11.15% | 8.33% | 74.71% | -2.82% |
| Graziano Pellè | 123 | 38 | 12 | 30.89% | 9.76% | 14.29% | 10.80% | 75.61% | -3.49% |
| Mario Balotelli | 56 | 20 | 1 | 35.71% | 1.79% | 10.08% | 6.51% | 64.60% | -3.57% |
| Peter Crouch | 59 | 17 | 8 | 28.81% | 13.56% | 13.07% | 8.63% | 65.99% | -4.45% |
Which in turn looks like this:
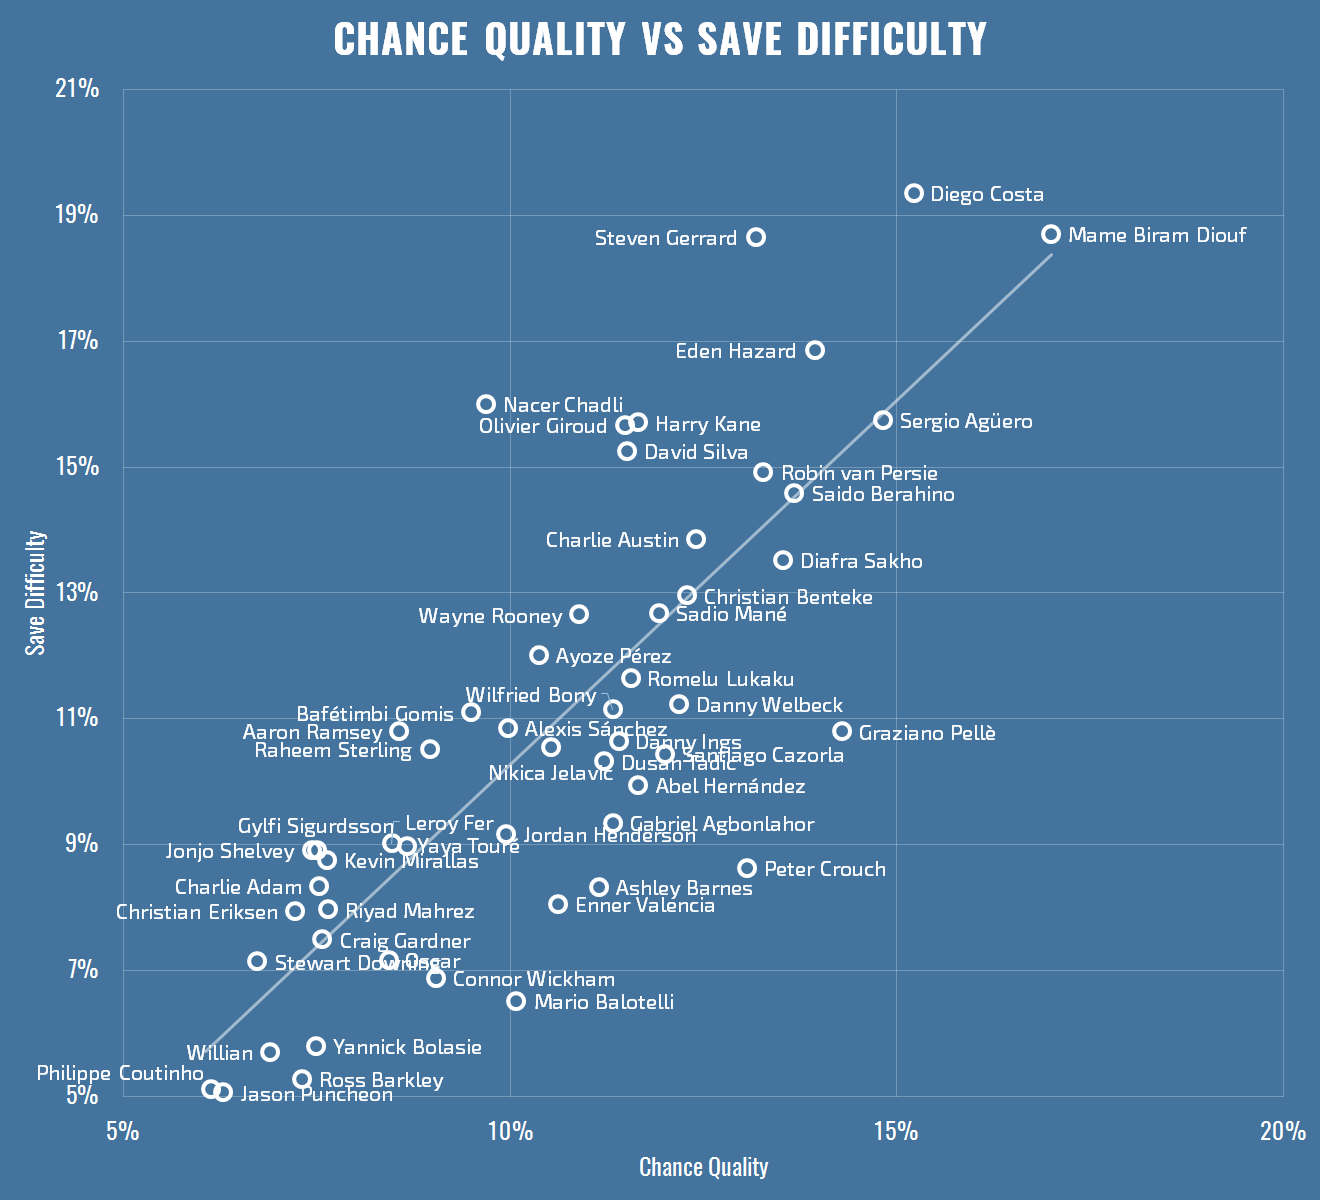
Steven Gerrard’s numbers here are padded a bit by penalties, but he took good penalties, so you can see the boost he gets. Costa was a monster, Nacer Chadli was incredibly sharp (though seems to have crashed hard this season, basically halving the xG on every shot). Ross Barkley’s chances were just as bad, but unlike this year, they didn’t go in. Jason Puncheon just needs to stop.
So this is fun, but is it really any more interesting than conversion rate et al? Let’s look at how predictive each season is of the next. I’ll limit it to full seasons, players with 50+ shots. Here’s how various metrics perform:
| Metric | R2 | ||
|---|---|---|---|
| 2011-2012 | 2012-2013 | 2013-2014 | |
| SoTR | 0.1967 | 0.041 | 0.0215 |
| Conversion | 0.4299 | 0.1271 | 0.2224 |
| Scoring % | 0.1844 | 0.0228 | 0.0584 |
| SD/SQ | 0.2122 | 0.2436 | 0.1161 |
| SD-SQ | 0.3498 | 0.2729 | 0.0929 |
While it’s clear we haven’t found the holy gail of a strongly repeatable shooting metric, I still like our composite model. It has the benefit that as my chance quality and save difficulty models get better, these numbers may also improve, and I’ll be sure to look into that.
At the very least, I think the idea of having small, granular models, and looking at the gaps between them is an interesting way to find some new metrics and insights, and I’ll see what else I can find with a similar approach.