Arsenal’s Injury Woes: Changing Directions

An interesting conversation broke out on Twitter tonight about the timeless mystery of Arsenal’s injury record. Personally, I’m with Raymond Verheijen – Arsene Wenger should stop holding Running Man style training sessions with chainsaws and stuff, that’s just common sense. But what other factors might be at play?

Naveen Maliakkal wondered if something about Arsenal’s style might contribute:

I’d love to see how much recover sprinting arsenal have to do since they don’t rely enough on stopping counters high up the pitch and instead trying to recover into deep positions then from rather deep positions they attempt to counter. Essentially it seems like then play a style that relies a lot on covering large distances quickly.

This piqued my interest, and I wondered if all this running backwards and forwards might be quantifiable. So I came up with a simple approach:

  1. For every player, take the list of their touches in a game.
  2. Split them into sets of three – (1) where the player was, (2) where they currently are and (3) where they will be next.
  3. Draw a line between 1 and 2, and 2 and 3.
  4. Calculate the difference in angle between these two lines, i.e. how much the player has to turn.
  5. Sum all of this for each team in each season.

Picture some examples:

total-angle

So, three touches, all going forwards in a straight line is an angle of zero – the player hasn’t turned at all. Turning either direction, left or right, is measured the same, and of course the maximum angle is 180° if the player makes a forward touch and then goes directly backwards to make another. The numbers below are actually done in radians, but I didn’t want to frighten anyone.

Whether or not that makes sense, what it roughly measures is how much back and forth in total each team’s bodies have had to go through. Guess who put in five out of the top ten EPL seasons?

Season Team Total Angle Turned
2014 Manchester City 117061
2013 Arsenal 114293
2012 Arsenal 112857
2014 Arsenal 112388
2013 Swansea City 112267
2011 Arsenal 111055
2014 Manchester United 110062
2011 Manchester City 110017
2010 Arsenal 109965
2010 Chelsea 109663

Arsenal appear five times in the top ten – year after year, their players are changing direction more than pretty much any other team.

Now, let me throw some caution on this approach:

  • I don’t take timestamps into account, so you don’t know if there’s a second or five minutes between touches, but this is the same for all teams and is hopefully evened out in the aggregate.
  • This doesn’t capture how players actually move, as they can run sideways and backwards.
  • Arsenal would necessarily appear at the top, because they are a dominant, attacking team that has lots of possession and moves the ball around a lot (like the Manchesters and Chelseas you see up there). This is also true, but maybe playing well hurts.
  • I haven’t checked the correlation between these numbers and historical injury data. For example Newcastle don’t place highly here but are having a nightmare this season, with 10 players out. I’ll attempt to gather some data tomorrow to see what correlation exists.

But at the very least, the fact that Arsenal hover near the top of the list every single year is intriguing, and I must thank Naveen again for pointing this out.

Arsenal’s Injury Woes: Changing Directions

State of the Stats 2015

I published a survey this week, asking people about their interest in football stats and analytics, their ambitions and skills. I could and probably should have asked a lot more: it’d be cool to know where you’re all based and what teams you support, if only to confirm that statsworld is a sea of Tottenham and Arsenal fans. It would have been good to quantify just how few smart women have a voice in the football stats community.

So I dropped the ball on that, but I think we have some interesting data besides. I’ve only been writing here for a month or so, and I took the somewhat circuitous route into football stats of following Ted Knutson back when he edited a Magic: the Gathering website. Because of that, I’m intrigued as to what’s holding more people back from writing, theorising, and generally contributing to the ruckus. Let’s find out!


Responses

I got 79 responses in the couple of days the survey was up – thanks to everyone that contributed, and to those that retweeted the link! Of these responses, 13 work at clubs professionally, and we’ll look at that in more detail later.

Age

It’s a weird feature of the statosphere that everyone seems to assume everybody else is young. Scamps like the Analytics FC mandem and student-bedroom YouTube sensation Joel Salamon distract us from some of the more venerable members of the community. What’s the truth?

ages

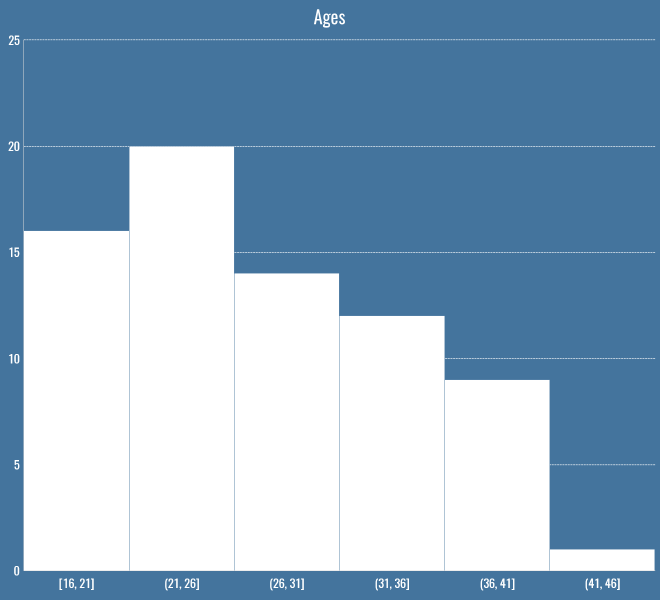
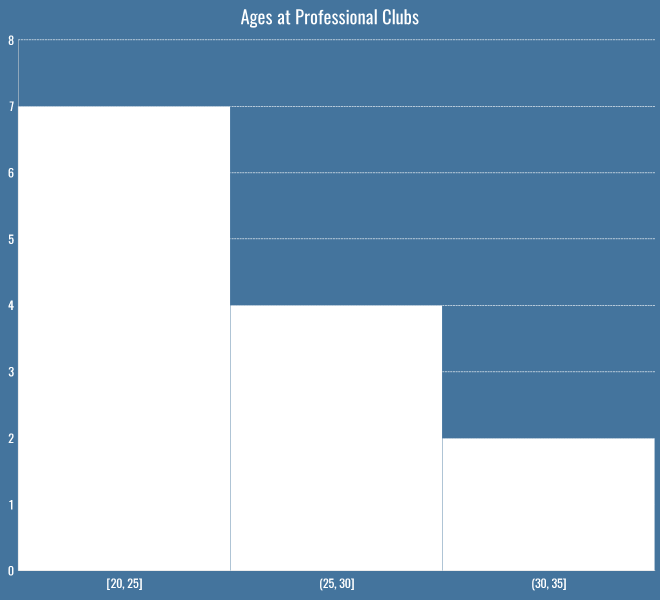
This is pretty left-leaning, and more pronounced when we just focus on the analysts at clubs:

professional-ages.png

The good news is, if you’re young and interested in football stats and analytics, the only barrier between you and clubs is how good you are and how you can get noticed. It’s also possible that most 35-year-olds don’t sit around all day filling out dumb online surveys because they have tons of work to do, I’m not sure.

Experience

One of the survey’s main motivations was finding out how many people were already involved in doing stats work, how many wanted to be, and what might be holding them back. Let’s look at what our respondents are up to:

experience

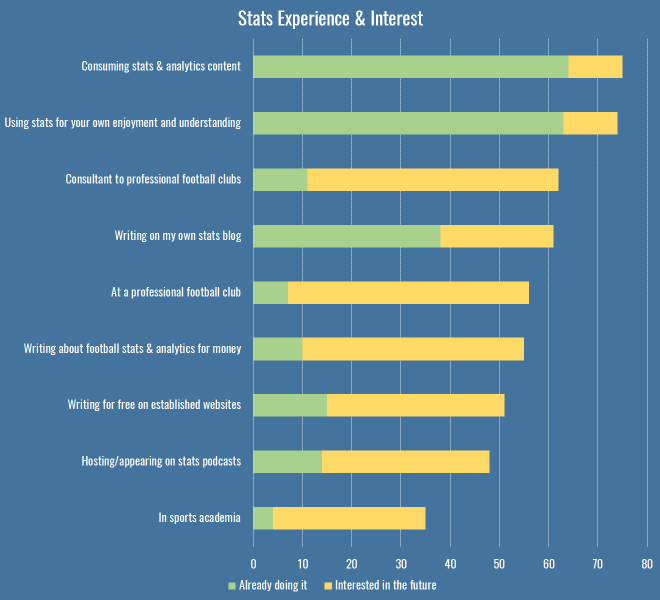
I like the blogging numbers – it’s nice to see that people are taking the advice to just get themselves out there – a good 60% of people who can see themselves blogging about stats have already taken the leap. People aren’t lying when they say that if you make good stuff, it’ll get noticed.

People’s ambitions here are pretty clear – getting into professional football clubs is most people’s dream, but one only realised for a few at this stage. More seem to want to do consultancy than take a full-time job at a club, perhaps just because the jobs are thin on the ground – I would still assume the median number of full-time stats people at Premiership clubs is zero.

There are also surprisingly few getting paid to write about stats. Outside of the echo chamber, there clearly isn’t an enormous market for stats-heavy pieces, but it’ll be interesting to see how this number changes as time progresses and the wider media incorporate more stats content.

Also worth noting the smallish numbers of people in academia. Given the dearth of paying jobs in the media, the limited number of jobs at clubs and the generally secretive nature of cutting edge work, I personally think it’d be great to see people in academia taking more of a leadership role in the stats community, but maybe my Twitter feed isn’t representative and I’m missing stuff.

Podcasting is increasingly popular, with Analytics FC hosting a series of impressive guests, and I missed off video as a medium, which is sad because in addition to Joel’s excellent videos (and their very entertaining comments sections), I think we can all agree that this is the single greatest contribution to football analytics.

Barriers

Given the hopes and dreams above, what’s holding us back? The survey asked about the biggest barriers holding back the community:

biggest-barriers

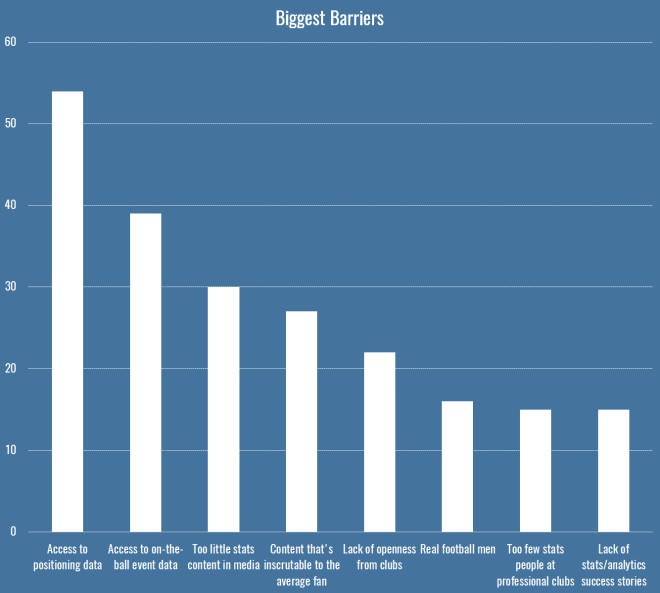
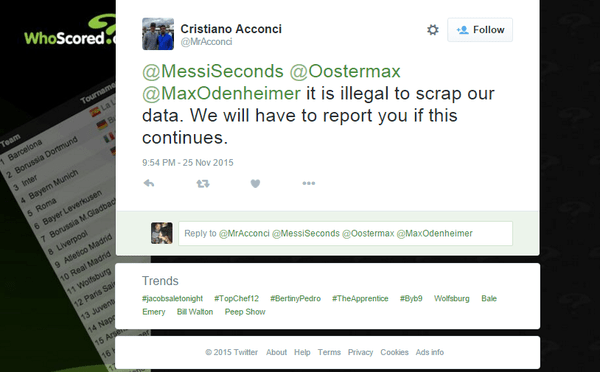
The two on the left are the most common complaints I see on the Twitter statosphere. Data is the lifeblood of stats work and it’s either very expensive to acquire, or time consuming and of dubious legality. The latter point’s important: even today, WhoScored took out a gun and aimed it at their foot in response to Joel’s latest video:

cusohocw4aakhrw

The situation gets even more complicated when it comes to positioning data, the holy grail for a lot of analysts. Clubs are in an odd situation that they have to opt-in to a sharing agreement to get positioning data about other clubs, and so there’s only a small handful that have any data at all. That’s a function of paranoia and also presumably a lot of clubs not having the resources to do anything useful with the data.

About data, I will just say this: in 10 years time, you will be able to create all the data that Opta and Prozone produce using smartphone-level video and open source computer vision software on your laptop. If someone with the resources of Google wanted to, they could do this in the next couple of years, for every match in the world. I do not believe for a second that the data side of the industry is a valuable long term investment, except in cases of really privileged information like training performances or behind closed doors in academies.

Opta and Prozone will thrive on having the best researchers working for them, in tandem with the best tactical minds at clubs. WhoScored and Squawka will thrive on having the best writers working for them, making this stuff accessible and interesting.

The best way for these companies to find this talent, it appears to me, is to free the data and hire everybody you think does something interesting with it. Maybe that’s naive.

Anyway, enough of that. Elsewhere, there is a lack of stats-focused content in the media. It’s been a year of progress – you’re almost as likely to hear “expected goals” on your TV these days as you are “rainy Tuesday night in Stoke”. It’s also been a year of recurring beef, with Neil Ashton’s seminal air-conditioning piece in the Mail and the fallout from Brentford’s misadventures in the managerial market.

All you can do is keep writing, make it accessible, and hope that narratives in the stats community pan out enough that you can build trust. I certainly think it would have been great for the media to pick up on the West Ham over-performing story, it’d be money in the bank for stats people. Make content that wins people arguments in the pub, and bit by bit people will become more accustomed to thinking about stats.

Getting Data

If data’s the biggest barrier to entry or progress in football stats, how are people getting it today?

getting-data

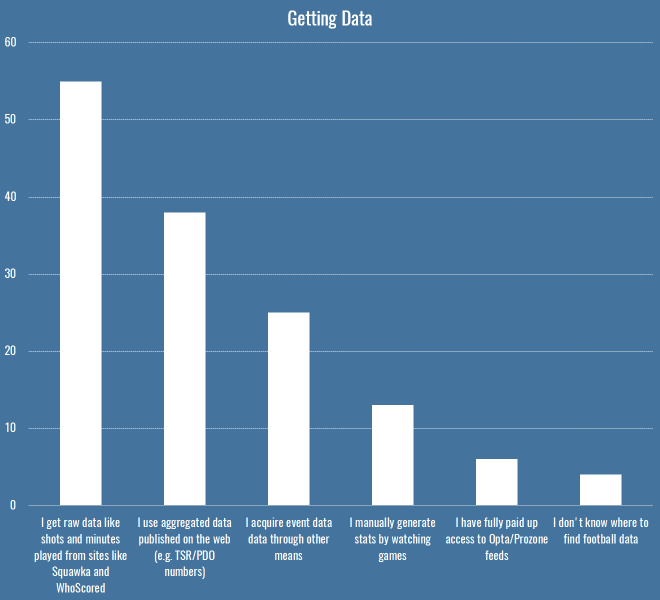
The most common thing to do is look at sites with accurate, timely raw numbers like WhoScored. Don’t scrape them and get in trouble, but do note that Squawka’s terms and conditions say this:

You are not permitted to use this website other than for private, noncommercial purposes. Use of any automated system or software to extract data from this website for commercial purposes (“screen scraping”) is prohibited. Squawka reserves its right to take such action as it considers necessary, including issuing legal proceedings without further notice, in relation to any unauthorised use of this website.

So for non-commercial purposes, maybe you’re fine. Ask your lawyer.

Kudos to the 13 people out there manually collecting stats. You can use tools like John Burn-Murdoch‘s pitch tracker to create data, and with enough time maybe you’ll have the best data in the world about set pieces or something.

In addition to these numbers, 44% of respondents to the “how do you manage football data?” say they keep a list of bookmarks to manage data. I suspect given these numbers that most people are able to judge players and teams reasonably well, looking at their shot numbers, or aggregated data like those at Objective Football. That’s a good foundation and indicates a great level of stats literacy in the community. It’s been brilliant to see the amount of stuff Paul Riley‘s been making public, as finally everyone has access to an expected goals model, raising the bar even higher.

It remains a shame that so few people have access to Opta feeds, but hopefully more and more aggregated data and tools can be made public without triggering some sort of retaliation from the owners of the data (who have paid lots of money and put lots of work into collecting it, I should make clear).

Tools

What are the secrets to doing magic with football stats? Well, no secrets, just the usual suspects:

tools

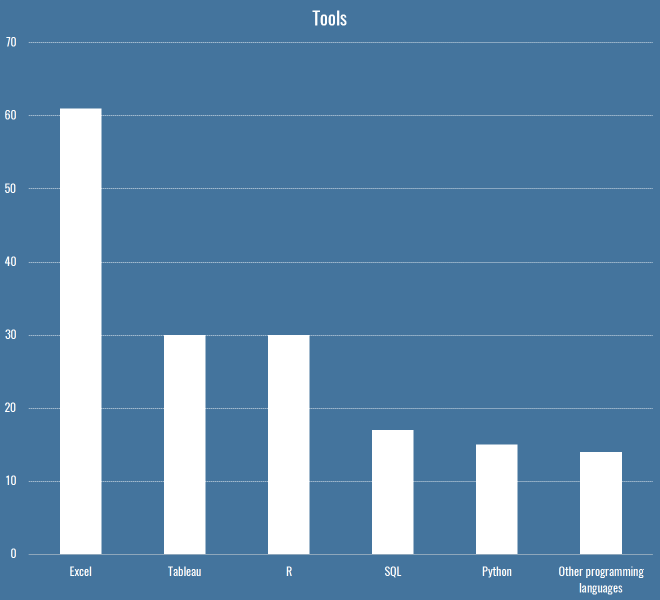
Almost everybody lives inside a spreadsheet of some sort. Tableau is pretty standard at this point, and R is about twice as popular as Python as the language of choice for stats work. Stata gets an honourable mention as it popped up a couple of times.

The SQL number is low, but I guess that reflects the fact that most people aren’t dealing with event data in bulk, or just make do with R dataframes or something. I was the only one that ticked the GIS box, and I think you’re all mad. Being able to do geometry stuff inside SQL is huge: my shot buildup charts are basically a 5-line query that runs in less than a second. If you ask me, everybody should be looking at putting stuff into SQL Server 2016 when it’s released, you get SQL, GIS functionality and embedded R, all in one platform. Get on BizSpark, it’s all free.

Modelling Knowledge

The survey had a big section asking people about the sort of metrics and models they can and do produce. I think this is one of the most important questions, because it shows where we might be falling down as a community in terms of education, but it also points at the areas that are primed for new research because fewer people are working on them.

modelling-knowledge

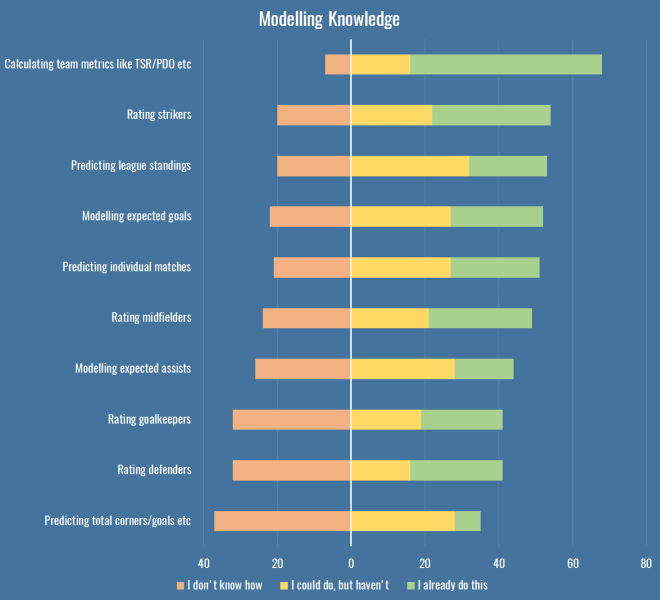
So on the left of zero you’ll see those that don’t currently know how to calculate a metric or build a useful model. On the right are those that know how, and indeed those that already have working models. Broadly speaking the techniques at the top are better known, and at the bottom are less known.

At the top is the simple stuff, calculating TSR and PDO is fairly straightforward, and it’s good to know how it’s done instead of just consuming the numbers. It also leads on to more advanced stuff, like calculating TSR/PDO but with xG numbers instead of goals and shots.

Strikers are, as ever, dead easy to model. Even just using surface stats like shots on target/90 and various conversion rates, you can get an idea of who’s good, who’s overperforming, and who is sustaining their performances between season.

At the other end of the spectrum, defender ratings obviously make an appearance – this is one of the hardest areas to judge, especially lacking positioning data that is key to so much defensive play.

Right at the bottom is predicting total corners/goals. This isn’t really that analytically useful, but for those of you that bet, these are big markets, and some of the easiest to find value in.

The appearance of goalkeeper ratings near the bottom is a surprise, if only because keepers are more or less the flipside of strikers. Tons of data available, clear metrics for what’s good and bad, even if you’re not using an xG-like model. I will take a moment to push my expected saves model and goalkeeper Christmas Shopping pieces.

A couple of people in the ‘other’ option mentioned working on youth models, or career predictions, which seems like a brilliant area to look into.

Education

I put three questions about education into the survey, mostly because I wanted to make it clear that you can do great stats work without too much formal education, maths or otherwise.

education

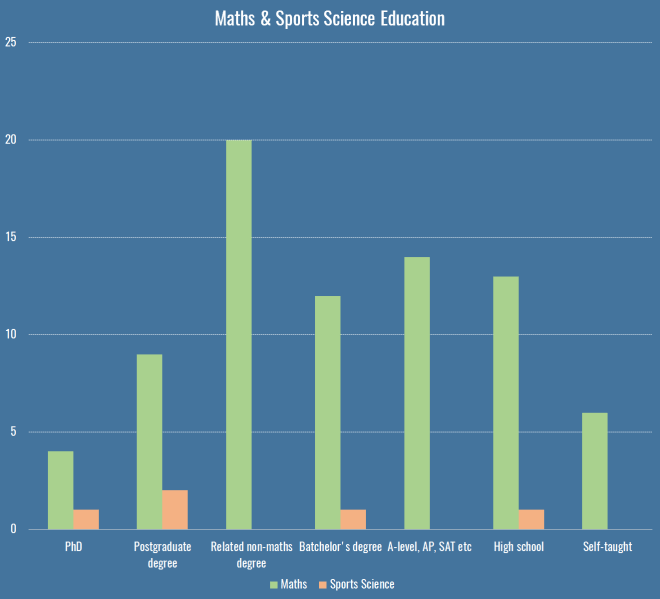
About 40% don’t have a degree, and most that do weren’t necessarily in mathsy subjects, instead doing stats in the social sciences, or taking maths modules in the natural sciences or computer science etc. That said, only 2 of the 13 respondents currently working with professional clubs had less than a batchelor’s degree, so be aware of that.

There weren’t many Sports Science respondents at all, and I’d be interested from anyone with an opinion about whether Sports Science degrees serve you well for work in stats or analytics.

I also asked about coaching qualifications. 9 of you have the equivalent of a Level 1 Certificate in Football, 2 have Level 2, and we were graced by 2 UEFA B Licensed coaches.

The Biggest Issue Facing The Stats Community Today

air-conditioning

The proportions remain the same inside professional clubs, and frankly I’m rethinking this whole stats career thing as a result. I’m game for unionising if you are.

Conclusions

You can download a slightly sanitized and anonymized version of the data here.

I don’t see a lot of statistically significant data pointing at surefire ways to get into paid work in football stats. But what I do see is tons of ways that we as a community could help, educate and collaborate with each other. I’d love to think that one day Alan Shearer will wake up every morning and check expected goals tables to see how the season’s going, but that’s a long way off, and in the meantime, it’s clear that there are loads of people that want to contribute more but can’t. I take my hat off to people like Analytics FC, whose podcast is putting important people and their work front and centre, and to Paul Riley, who as much as anyone seems to be trying to put his work (and importantly, his data) out in the open for people to build on. And most of all, huge props to StatsBomb, who I think served as the epicentre and catalyst for a lot of people to either start thinking about stats stuff, or even better to get off their arses and write about it.

So let’s all ask ourselves what we can do to help each other. I know there are tons of smart people out there that have great ideas but perhaps not the programming skill. I know there are great programmers who have no idea where to get data from. If anyone sees my stuff and wants to know how it came to be, get in touch, maybe I can give you some pointers.

In the meantime, one idea that I thought was worth doing straight away, was building a custom football stats search engine. My hope is that this will make it a little easier to find existing research to bring yourself up to speed, find new avenues of research, or at the very least, avoid wasting time redoing work that’s already been done. Annoyingly I’m on WordPress.com here so can’t embed it, but you can bung the following code on your site and get a search box for it:


  (function() {
    var cx = '018110615440115988629:xtvxg7sucik';
    var gcse = document.createElement('script');
    gcse.type = 'text/javascript';
    gcse.async = true;
    gcse.src = (document.location.protocol == 'https:' ? 'https:' : 'http:') +
        '//cse.google.com/cse.js?cx=' + cx;
    var s = document.getElementsByTagName('script')[0];
    s.parentNode.insertBefore(gcse, s);
  })();

<gcse:searchbox-only></gcse:searchbox-only>

Or even without script:

<form action="http://www.google.co.uk/cse" id="cse-search-box" target="_blank">
<input name="cx" type="hidden" value="018110615440115988629:xtvxg7sucik" /> 
<input name="ie" type="hidden" value="UTF-8" />
<input name="q" size="30" />
<input name="sa" type="submit" value="Search" /> 
</form>

Bookmark it, use it, tell me if there are sites missing that should be indexed. It’s not much, but it’s something I kept wishing existed, so hopefully it helps a tiny bit.

… And Relax

Thanks again to everyone that contributed to the survey, I hope the results are interesting. In six months or a year I’ll probably do this again, so I’d love some suggestions for questions for next time around.

State of the Stats 2015

Defence, Territory and Control

There comes a time in your adolescence as a stats writer when your parents rudely awaken you in the middle of the night, bundle you into a car, and drop you in the middle of a dark forest with nothing but a sharp stick. “It’s time you made your own defensive metric,” they tell you before receding into the darkness. It is a rite of passage every statto must endure alone.

Frightened and cold, you look for shelter. xG, you think. I know xG, good old xG, I can use that for something! But others have been here before, the forest has been hunted barrenWhat about those bright green diagrams everyone claims to like, could I just use those? Carving numbers into trees with your trusty pointy stick, you get to work.


As anyone who follows this blog will know, I’m quite interested in space and how teams use it. Today I’m going to look at the territory claimed by defenders and I’m going to propose a metric based on the actions they allow within that territory. It’s just one metric, it’s not the be-all and end-all of measuring defenders or defences, but I think it’s vaguely interesting, and its opinion on a lot of defenders is defensible. It has some flaws that’ll probably be obvious to you, but I’ll mention them as we go.

What does a defender’s territory look like? Here’s how Arsenal looked against Tottenham in the North-London derby:

defensive-areas-1448157062630

Here’s Aston Villa’s clean sheet against Manchester City:

defensive-areas-1448157097475.png

And here’s Newcastle from their 1-0 smash and grab against Bournemouth:

defensive-areas-1448157225615

These are similar to my shot buildup charts, but for defensive actions. For each defender, we take all their own-half defensive actions (tackles, blocks, interceptions, clearances, aerial challenges and indeed fouls), and draw a line around them. This is their territory, it’s the part of the pitch they seem to want to be responsible for.

Now you could argue we could just split the final third of the pitch into four and assign each slice to a defender, but I think the overlaps are very valuable here – you want to know if a defender drifts inside or out, how far they push forwards etc. Obviously drawing the lines like this leaves gaps – nobody’s taking responsibility right at the edges or corners of the pitch. There’s also the problem of a player that makes a single tackle on the other side of the pitch, stretching their territory, perhaps unfairly. We could add a bit of a buffer zone to these areas, and trim some outliers, but for now I’m happy with them as they are – they are the best way we have of outlining a defender’s territory, based entirely on where the defender tries to defend.

Glancing at the charts above, you’ll notice some players have more territory than others. We want a metric that rewards this, if possible – if a player is bossing the entire danger zone, that’s great, even if you might prefer to see their team-mates step in. So our metric’s first ingredient is the surface area of a defender’s territory.

But the positioning on its own is meaningless, we want to know how much control they exert in that space. For this, we count the number of touches opponents take in the defender’s territory. These aren’t touches as you see them on TV, these are just all the aggregate events we see in the data – passes, dribbles, shots, all the stuff opponents want to do in our half. We have to be careful here to count points inside the territory, and only those that overlap the defender’s time on the pitch.

We combine these by dividing the area by the number of touches, then we weight things by possession and per-ninetify everything. What you should picture is the defender scent-marking their territory (I find it easiest to picture John Terry doing this, for some reason), and then every opposition action diluting that scent more and more. Larger territory will necessarily be exposed to more opposition actions, but good defenders will prevent and repel as much of this as possible. Players that make fewer defensive actions will have tiny territories, but can still score highly by keeping opponents out.

What’s nice about this particular metric is that it doesn’t force you to work out whether tackles or interceptions or aerials or whatever are more important, and it doesn’t require you to look at shots and xG (or expected assists etc). It captures defensive pressure in open play, which is where most defending happens.

So, recapping the algorithm:

Area ÷ Opposition Touches ÷ Possession ÷ Minutes Played × 90

I like to refer to this as ‘Possession-adjusted Territorial Control Held’, or PaTCH. I am not good at acronyms, please suggest more. In the meantime, which defenders have a good PaTCH?

Player Team PaTCH
Gabriel Armando de Abreu Arsenal 596.2
John Terry Chelsea 302.0
Chris Smalling Manchester United 268.2
Cedric Ricardo Alves Soares Southampton 265.4
Nicolás Otamendi Manchester City 261.9
Matteo Darmian Manchester United 256.7
Sylvain Distin Bournemouth 255.1
Eliaquim Mangala Manchester City 250.1
Sebastian Prödl Watford 248.4
Virgil van Dijk Southampton 238.4
Mamadou Sakho Liverpool 237.2
Joleon Lescott Aston Villa 233.2
Allan-Roméo Nyom Watford 226.6
Fabricio Coloccini Newcastle United 226.4
Aleksandar Kolarov Manchester City 209.8
Neil Taylor Swansea City 208.4
Ashley Williams Swansea City 202.1
Laurent Koscielny Arsenal 195.3
Simon Francis Bournemouth 194.4
César Azpilicueta Chelsea 189.2
Luke Shaw Manchester United 187.7
Kurt Zouma Chelsea 185.4
Toby Alderweireld Tottenham Hotspur 185.0
Ryan Bertrand Southampton 182.2
Steven Whittaker Norwich City 176.8
Gareth McAuley West Bromwich Albion 175.1
Micah Richards Aston Villa 174.3
Jose Fonte Southampton 171.8
Russell Martin Norwich City 171.0
Glen Johnson Stoke City 170.9
Jeffrey Schlupp Leicester City 167.3
Daley Blind Manchester United 163.9
Bacary Sagna Manchester City 158.7
Phil Jagielka Everton 158.4
Nathaniel Clyne Liverpool 158.3
Ciaran Clark Aston Villa 155.5
Federico Fernandez Swansea City 150.3
Sebastien Bassong Norwich City 148.9
Vincent Kompany Manchester City 146.4
Per Mertesacker Arsenal 146.0
Martin Kelly Crystal Palace 145.1
Nacho Monreal Arsenal 142.1
Craig Cathcart Watford 139.9
Joel Ward Crystal Palace 138.1
Martin Skrtel Liverpool 138.0
Charlie Daniels Bournemouth 135.7
Ben Davies Tottenham Hotspur 135.2
Joseph Gomez Liverpool 134.9
Robbie Brady Norwich City 134.7
Winston Reid West Ham United 132.8
Jan Vertonghen Tottenham Hotspur 132.1
Alan Hutton Aston Villa 131.9
Jordan Amavi Aston Villa 128.6
Aaron Cresswell West Ham United 128.4
Maya Yoshida Southampton 127.4
Tommy Elphick Bournemouth 126.6
Héctor Bellerín Arsenal 119.5
Philipp Wollscheid Stoke City 119.4
Branislav Ivanovic Chelsea 117.8
Kyle Walker Tottenham Hotspur 116.9
Geoff Cameron Stoke City 116.8
Erik Pieters Stoke City 116.0
Carl Jenkinson West Ham United 115.7
Gary Cahill Chelsea 114.5
Marc Muniesa Stoke City 114.3
Kyle Naughton Swansea City 111.3
James Tomkins West Ham United 110.8
Scott Dann Crystal Palace 107.7
Steve Cook Bournemouth 107.0
John Stones Everton 106.8
Daryl Janmaat Newcastle United 104.4
Jonny Evans West Bromwich Albion 103.7
Chris Brunt West Bromwich Albion 103.1
Ritchie de Laet Leicester City 103.1
Danny Rose Tottenham Hotspur 100.0
Wes Morgan Leicester City 97.4
Robert Huth Leicester City 95.3
Brendan Galloway Everton 95.0
Dejan Lovren Liverpool 92.3
Billy Jones Sunderland 90.7
Nathan Aké Watford 90.2
Pape Souaré Crystal Palace 85.4
Seamus Coleman Everton 84.6
Massadio Haidara Newcastle United 83.2
John O’Shea Sunderland 82.7
Younes Kaboul Sunderland 80.5
Craig Dawson West Bromwich Albion 77.5
Chancel Mbemba Newcastle United 74.0
Damien Delaney Crystal Palace 70.1
Sebastián Coates Sunderland 69.1
Patrick van Aanholt Sunderland 68.4
Brede Hangeland Crystal Palace 64.6

These are filtered for defenders with 450+ mins (all data from before Saturday’s games), and I’m calculating the average PaTCH over those games. Note: as usual, ballsed up a bit, the graphics show territory marked out in the defender’s own half, the numbers are actually calculated for territory in the final third. But it’s cool, cos comparing the two sets of numbers will make for an interesting article in a bit.

Gabriel is such an outlier because of Arsenal’s 1-0 win over Arsenal, in which Mitrovic got sent off and Newcastle had one shot. Look at the territory:

defensive-areas-1448159902841

Now look at the heatmap from the BBC (Newcastle on the left):

85262060_arsenalnewcastleheatmaps

Newcastle had one touch in his territory, as far as I can tell, giving an astronomical match PaTCH (yup) in the three-thousands. Anyway, I will think of some better averaging or thresholding to reduce the impact of stuff like this, but still, he sort of earned it.

Elsewhere, you can see the model doesn’t like Sunderland or Crystal Palace much, but is a little bullish on Aston Villa’s defence. Of course this weekend Lescott was benched against Everton, and Villa decided to sit very deep and let Everton play, with horrific results. Everton themselves seem to have ridden their luck a few times – Galloway, Coleman and Stones bomb forward regularly and rely on Barry and McCarthy to pick up the slack in their territory, something I’d like to capture in the numbers at some point. Terry is still good at some stuff, Smalling’s number is consistent with the hype, Otamendi is predictably up there, and Koscielny is doing fine, though he’d probably benefit from that forever delayed defensive midfield signing for Arsenal. Lovren near the bottom, below every Liverpool and Southampton player.

For now, I’m reasonably happy with who shows up at the top and bottom. Over the next few days I’ll play with some historical data to tell some stories, incorporate this metric with a Christmas Shopping piece about defenders, then make some visualisations to see if there’s a good counterpart to the attacking buildup maps.

Defence, Territory and Control

Christmas Shopping: Goalkeepers

The nights are getting longer up here in the Northern Hemisphere, and soon children will be donning their traditional transfer window jumpers and gathering around open fires to sing traditional transfer window songs. In preparation for the festive season, I’m going to think about teams with really obvious deficiencies, and work out what Santa’s elves might be able to fax over on deadline day to fix them.

We’re going to start with goalkeepers, because frankly it’s easiest to draw up a naughty list of of rubbish keepers using our expected saves model. Below is the list of all keepers that have on average underperformed in the last five seasons, i.e. they’ve made fewer saves than the expected saves model expected. The rating is simply saves over expected saves, times 100. 100 is a keeper that saved exactly what the model thought they should, over is good, under is bad.

An aside as an Everton fan: I am going to note here that the player just above this list, who only just scraped a rating of 100.1, is Tim Howard. I don’t believe he’s as bad as most Everton fans like to make out (he’s just above Joe Hart in this year’s ratings, basically in the middle of the pack), but those that want to play along can by all means picture my recommendations below as applying to Everton as well (or indeed whichever team you happen to support). Just note that whoever Everton might get in will be facing the second most shots of any keeper in the Premier League, and mistakes will be made.

Keeper Season
2010 2011 2012 2013 2014 2015 Avg
Simon Mignolet 99.3 101.5 107.7 96.6 98.2 93.3 99.4
Julian Speroni 103.1 95.1 99.1
Tom Heaton 98.7 98.7
Richard Kingson 98.7 98.7
Adam Federici 98.4 98.4
Ben Hamer 98.2 98.2
Ali Al-Habsi 102.2 100.2 92.1 98.2
Matthew Gilks 98.0 98.0
John Ruddy 100.4 100.1 98.3 92.9 97.9
Robert Elliot 92.3 97.6 102.9 97.6
Brad Friedel 94.4 101.7 96.4 97.5
Bradley Jones 97.4 97.4
Kasper Schmeichel 98.7 95.9 97.3
Costel Pantilimon 90.9 104.5 96.4 97.3
David Marshall 97.2 97.2
Paulo Gazzaniga 103.6 90.3 97.0
Tim Krul 87.2 101.2 99.7 101.0 95.4 95.3 96.6
Boaz Myhill 85.4 108.8 87.4 104.9 96.1 96.5
Thomas Sørensen 99.4 99.7 89.9 96.3
Steve Harper 97.4 87.0 96.4 104.5 96.3
Adam Bogdan 93.3 99.3 96.3
Mark Bunn 96.3 96.3
Marcus Hahnemann 96.2 96.2
Robert Green 97.2 91.6 99.9 96.2
Gerhard Tremmel 102.5 88.2 95.3
Wayne Hennessey 95.6 100.4 89.9 95.3
Anders Lindegaard 107.0 83.3 95.1
Brad Guzan 98.1 97.8 92.6 96.7 89.9 95.0
Joel Robles 92.5 96.0 94.3
Kelvin Davis 90.5 96.9 93.7
Paul Robinson 101.3 85.9 93.6
Artur Boruc 95.3 100.4 85.0 93.5
Scott Carson 93.1 93.1
Patrick Kenny 91.4 91.4
Allan McGregor 93.7 87.4 90.5
Maarten Stekelenburg 93.9 83.1 88.5
Dorus de Vries 85.8 85.8
Stuart Taylor 81.2 81.2

There are a few main things I want to note here:

  1. Southampton have terrible taste in keepers – Boruc, Davis, Stekelenburg, all generally underperforming expected saves. Fraser Forster may come good, but until then, Southampton’s overall organisation is covering up a lack of quality between the posts.
  2. Bournemouth are in real trouble – Boruc isn’t great (not shown here is his 3 mistakes leading to goals already this year), and Adam Federici hasn’t done much better, but he’s left off this table as he’s below the 10-save cutoff. On top of these fairly poor performances is the fact that the shots Bournemouth are allowing are far, far trickier than any other team in the league (0.42xg against Boruc, 0.48 against Federici, against a league average of about 0.3), so literally anyone in their goalmouth would struggle.
  3. Brad Guzan is the only keeper consistently, year after year, to underperform expected goals but keep his place. The 100-based ratings actually boost him up the table a bit – in terms of raw goals above/below expected, Guzan is last this year, last in 2013, and firmly bottom 6 every season he plays. That’s partly Aston Villa’s woeful defence, but I do not know how Guzan has kept his place for so long.

Of this year’s relegation candidates, Robert Elliot, standing in for Tim Krul at Newcastle, is the only keeper to be performing above expected saves, by a teeny 0.3 goal margin. Pantilimon at Sunderland is poor but not the worst, Bournemouth would probably benefit more from a defensive shakeup to reduce the quality of chances conceded, and I think that leaves Aston Villa as the prime candidates for an upgrade. I might argue in a future post that their defence needs patching (*cough* Alan Hutton *cough*), but they’re conceding chances with an average 0.25xg which isn’t terrible. Guzan, however, is four goals down on where he should be this season and if history’s anything to go by, he’s going to get continue leaking goals. This is the last five seasons in detail:

Season Mins Shots Saves Goals Save % Expected Saves +/- Expected Shot Difficulty Rating
2015/16 1134 58 39 19 67% 43.4 -4.4 25.2 89.9
2014/15 3201 148 101 47 68% 104.5 -3.5 29.4 96.7
2013/14 3570 167 110 57 66% 118.8 -8.8 28.9 92.6
2012/13 3385 174 114 60 66% 116.6 -2.6 33.0 97.8
2011/12 620 26 18 8 69% 18.3 -0.3 29.4 98.1

So it kinda goes without saying, looking at the historical data above, that Villa could have sorted this out over the Summer, or last year, or the year before. But we’re entering a hypothetical world here where teams might agree to sell their first-choice goalkeeper in the January window, and those keepers might agree to join a team at or near the bottom of the Premier League, plus or minus any sort of reaction that Remi Garde gets between now and then. Let’s assume that nobody is going to drop down from a team above Villa to help out, otherwise I’d probably just point at Jack Butland and be done with it. Villa have been bringing in youth over the Summer, so let’s look at keepers 25 and under in Europe, playing at teams not currently in European competition, with decent ratings from our model. Let’s just assume that Premier League TV money is enough to land one of these targets. Who’s out there?

Keeper Mins Shots Saves Goals Save % Expected Saves +/- Expected Shot Difficulty Rating
Timo Horn 4155 231 177 54 76.6% 165.2 11.8 28.1 107.2
Gerónimo Rulli 2922 133 93 40 69.9% 87.9 5.1 33.1 105.8
Julián 1491 101 75 26 74.3% 71.1 3.9 20.2 105.5
Loris Karius 6208 349 257 92 73.6% 244.8 12.2 29.6 105.0
Benjamin Lecomte 4968 246 178 68 72.4% 171.0 7.0 29.1 104.1
Alphonse Areola 4386 183 131 52 71.6% 126.3 4.7 33.2 103.7
Marco Sportiello 4881 269 197 72 73.2% 191.1 5.9 30.2 103.1
Mattia Perin 9428 548 388 160 70.8% 380.0 8.0 30.6 102.1
Nicola Leali 3587 195 135 60 69.2% 132.9 2.1 31.3 101.6
Oliver Baumann 10447 573 406 167 70.9% 404.9 1.1 29.2 100.3

I’ve snuck Alphonse Areola in here despite the fact that he’s on a season long loan, just because he is/was vaguely available in principle. Any of these players, dead or alive, would probably be an improvement, and it seems like the transfer rumour mill, and potentially even Villa’s scouts, are ahead of me, they’ve been linked with Mainz’s Karius, and indeed Timo Horn. I don’t have Championship data, or smaller foreign leagues, so I will rely on those of you with eyes to fill me in there.

It’s worth noting that perhaps these numbers miss important parts of a modern goalkeeper’s game: Paul Lambert certainly rated Guzan’s distribution, we ought to look into that. Here’s everybody’s overall passing numbers:

Keeper Passes Completed Ratio
Oliver Baumann 4898 3096 0.63
Timo Horn 1537 953 0.62
Loris Karius 2633 1560 0.59
Gerónimo Rulli 973 574 0.59
Marco Sportiello 1616 931 0.58
Alphonse Areola 1383 798 0.58
Nicola Leali 1122 651 0.58
Mattia Perin 3167 1839 0.58
Benjamin Lecomte 1690 939 0.56
Brad Guzan 4455 2450 0.55
Julián 473 234 0.49

And here’s everything over 40 yards:

Keeper Passes Completed Ratio
Gerónimo Rulli 666 295 0.44
Nicola Leali 779 337 0.43
Brad Guzan 3181 1319 0.41
Marco Sportiello 1034 417 0.40
Julián 370 149 0.40
Oliver Baumann 2592 940 0.36
Benjamin Lecomte 1064 378 0.36
Timo Horn 857 305 0.36
Loris Karius 1527 548 0.36
Alphonse Areola 836 290 0.35
Mattia Perin 1845 641 0.35

So Guzan has 5% over Timo Horn on long balls, take it or leave it.

It remains to be seen whether Aston Villa’s transfer window tree will be sheltering a Timo Horn-shaped present this holiday season – I nearly ran the numbers on January goalkeeper transfers to see if it happened that regularly – but I’ll leave that for the more enterprising of you. It’s possible these targets have been approached and Villa have neither the ambition nor the spending power to land any of them. All you can ask for in your letters to Lapland this year is that Remi Garde gets Villa’s Summer signings to gel into some sort of attacking unit, Jack Graelish stops being peak-Ross Barkley wasteful, and someone keeps putting their face in the way of the ball.

Christmas Shopping: Goalkeepers

Prime Creators

Time for a big, long Monday-morning table. Given our attacking buildup data, turns out it’s easy to calculate the number of attacking moves (moves that lead to shots, remember) in which each European player has been involved. That in turn makes it easy to identify each team’s prime creator – the player involved in the most attacking moves per 90, whether it be passes, shots, dribbles, whatever. The cut-off is 450 minutes, here they are:

Team Player Attacks p90
Napoli Lorenzo Insigne 11.72
Arsenal Mesut Özil 10.84
Manchester City Kevin De Bruyne 10.83
Real Madrid Cristiano Ronaldo 10.80
Barcelona Neymar 10.77
Juventus Paulo Dybala 10.38
Paris Saint-Germain Ángel Di María 9.82
Lyon Mathieu Valbuena 9.50
Celta de Vigo Nolito 9.47
FC Bayern München Douglas Costa 9.41
Roma Miralem Pjanic 9.21
Fiorentina Josip Ilicic 8.99
Bayer 04 Leverkusen Hakan Calhanoglu 8.92
VfB Stuttgart Daniel Didavi 8.62
Internazionale Stevan Jovetic 8.53
West Ham United Dimitri Payet 8.48
Milan Giacomo Bonaventura 8.33
Borussia Dortmund Henrikh Mkhitaryan 8.24
Tottenham Hotspur Christian Eriksen 8.20
Liverpool Philippe Coutinho 8.16
Marseille Abdel Barrada 8.15
Sevilla Michael Krohn-Dehli 8.07
Chelsea Cesc Fàbregas 7.98
Empoli Riccardo Saponara 7.65
FC Schalke 04 Julian Draxler 7.57
Swansea City Jonjo Shelvey 7.49
Chievo Valter Birsa 7.48
Palermo Franco Vázquez 7.43
Norwich City Nathan Redmond 7.35
FC Augsburg Caiuby 7.29
Bordeaux Wahbi Khazri 7.26
Atalanta Maximiliano Moralez 7.17
Rayo Vallecano Jozabed 7.16
Southampton Dusan Tadic 7.07
Everton Ross Barkley 7.05
Deportivo de La Coruña Luis Alberto 7.03
Caen Andy Delort 6.92
SV Werder Bremen Zlatko Junuzovic 6.88
Sassuolo Domenico Berardi 6.88
FC Ingolstadt 04 Pascal Groß 6.85
Monaco Stephan El Shaarawy 6.82
Genoa Diego Perotti 6.81
Manchester United Memphis Depay 6.78
Udinese Francesco Lodi 6.75
Málaga Duda 6.69
Eibar Saúl Berjón 6.66
Guingamp Yannis Salibur 6.62
Athletic Club Raúl García 6.58
Lazio Keita 6.56
Atlético de Madrid Antoine Griezmann 6.53
Watford Almen Abdi 6.53
Leicester City Riyad Mahrez 6.49
Nice Jean Seri 6.49
Frosinone Robert Gucher 6.44
Espanyol Marco Asensio 6.39
VfL Wolfsburg André Schürrle 6.31
Valencia CF Daniel Parejo 6.29
Newcastle United Ayoze Pérez 6.27
Las Palmas Jonathan Viera 6.17
Real Sociedad Rubén Pardo 6.16
Lorient Yann Jouffre 6.10
Angers Thomas Mangani 6.06
Crystal Palace Bakary Sako 6.05
Borussia Mönchengladbach Ibrahima Traoré 6.05
Sunderland Adam Johnson 6.03
Montpellier Ryad Boudebouz 5.98
Getafe Pedro León 5.97
Levante Morales 5.86
Rennes Kamil Grosicki 5.82
Nantes Jules Iloki 5.81
St Etienne Nolan Roux 5.76
Lille Sofiane Boufal 5.75
Troyes Corentin Jean 5.72
Toulouse Óscar Trejo 5.67
Hannover 96 Hiroshi Kiyotake 5.65
Sampdoria Éder 5.58
Bournemouth Matt Ritchie 5.52
Bologna Franco Brienza 5.40
GFC Ajaccio Damjan Djokovic 5.35
Verona Federico Viviani 5.27
Carpi Matteo Fedele 5.25
Eintracht Frankfurt Marc Stendera 5.24
Stoke City Marko Arnautovic 5.18
Hamburger SV Lewis Holtby 5.08
Granada CF Rubén Rochina 5.04
West Bromwich Albion James Morrison 5.02
Hertha BSC Vladimir Darida 5.02
Real Betis Joaquín 4.97
SV Darmstadt 98 Konstantin Rausch 4.95
1. FSV Mainz 05 Yoshinori Muto 4.90
Bastia Sadio Diallo 4.86
Aston Villa Rudy Gestede 4.79
1. FC Köln Anthony Modeste 4.74
TSG 1899 Hoffenheim Eduardo Vargas 4.71
Reims Nicolas de Preville 4.71
Sporting de Gijón Alen Halilovic 4.63
Torino Daniele Baselli 4.60
Villarreal Manu Trigueros 4.22

Özil only just beating out half a dozen or so other Arsenal players in that free-wheeling attack, de Bruyne sneaking up on a limited number of minutes, and someone explain Villareal to me. Turns out they’re 5th, but they don’t appear to attack much?

Prime Creators

Europe’s Most Direct Teams

I will continue flogging this attacking shape data until I find a good use for it, but here’s a bit of fun: given the average height of team’s attacks, i.e. the amount of ground covered towards their opponent’s goal, and the duration of those attacks, we can calculate the pace at which teams hurtle towards the opposition goal. It’s a pretty nice measure of how ‘direct’ teams are, and here’s who comes out top:

Team Attacking Pace (m/s)
Caen 3.63
SV Darmstadt 98 3.33
Leicester City 3.26
Villarreal 3.24
Crystal Palace 3.17
FC Ingolstadt 04 3.16
Eibar 3.16
TSG 1899 Hoffenheim 3.13
Sevilla 3.13
Sporting de Gijón 3.11
VfB Stuttgart 3.04
Eintracht Frankfurt 2.98
Lille 2.95
Guingamp 2.94
Carpi 2.94
1. FSV Mainz 05 2.94
Troyes 2.93
St Etienne 2.92
Angers 2.91
Toulouse 2.88

You can read more about Caen’s quick transitions and counter-attacking play in this article by Mohamed Mohamed on StatsBomb. It’s worth noting that for the numbers I have available (2012+ outside the EPL), this year’s Caen are currently the fastest attacking side I can find, so they’re probably worth a watch this season. They’re currently sitting 5th in Ligue 1. 2010 Blackburn Rovers are second, with half a season of Big Sam (auditioning for the Inter and Real jobs, if you remember) and half Steve Kean. I’ll leave it to you to dig those tapes out…

Guess who’s propping up the table at the bottom?

Team Attacking Pace (m/s)
Manchester City 2.26
Swansea City 2.24
FC Augsburg 2.20
FC Bayern München 2.17
VfL Wolfsburg 2.07
Fiorentina 2.07
Nice 2.05
Paris Saint-Germain 2.05
Juventus 2.00
Manchester United 1.92

You’ll be happy to hear that Man Utd’s buildup play this year is only the second slowest on record. They were beaten out by none other than… last year’s Man Utd.

One last bonus, the Pep effect:

Season Team Attacking Pace (m/s)
2015 Barcelona 2.78
2013 FC Bayern München 2.33
2012 FC Bayern München 2.33
2013 Barcelona 2.27
2014 Barcelona 2.27
2012 Barcelona 2.24
2015 FC Bayern München 2.17
2014 FC Bayern München 2.16
Europe’s Most Direct Teams

Visualising Attacking Shape

Today I’ve been experimenting with how to visualise the attacking geometry data I’ve been calculating. If you’ve seen the previous posts you’ll know that I’ve been mostly able to calculate width, height and duration for passing moves that lead to shots. I want to use this data to get a feel for how different teams attack and ultimately what types of attack are effective.

The data is still a bit problematic. I’m only interested in attacking buildup – shots from free-kicks, or directly after turnovers don’t show up because there’s only one event in the move, the shot itself. There’s also a bit of fuzziness that perhaps over-eagerly associates passages of play with an attack – this is because of quick changes in possession. Basically you have two options:

  1. Reset the buildup whenever the attacking team loses the ball. This means you’re incredibly sensitive to attempted clearances or aerial challenges.
  2. Allow a little leeway for the attacking team to win possession back.

I chose the latter – after an unsuccessful pass which gives the opponents the ball, if the attacking team can get the ball back within 5 seconds, it’s credited as part of the same attacking move. It results in us capturing many more moves around the box (where deflections, clearances and aerial challenges are common) at a cost of elongating some moves in the middle of the park where you might argue that the ball is actually evenly contested. There are other caveats that I hope are sensible: I don’t track shots after rebounds unless they grow into their own move, otherwise I’d risk measuring the build-up play twice. I also don’t track moves across dead-ball situations, so fast throw-ins or free-kicks don’t get added to previous build-up play.

Once you have that data to build upon, it’s very easy to take some averages and lose interesting truths – by averaging out Tottenham’s numbers, for example, you lose sight of their fast vertical attacks as they’re swamped by patient side-to-side buildup play. So instead of creating a team-by-team visualisation, I’m attempted to cram all of a team’s attacks in a single game onto one image. My hope is that this lets you look how and where they’re attacking at a glance – what parts of the pitch, how wide the move is, how long it took, how much vertical space it gained. Just the sheer volume of space a team uses while attacking should give a fairly good indicator of their control in a match.

Anyway, let’s see – I’d appreciate any comments about these. It’s possible it’s too much for one visualisation, and perhaps they’re a bit garish when you have a team with tons of shots. But hopefully you’ll agree that there’s some interesting information to be gleaned just from a quick glance.

Let’s start with a busy one, this is Tottenham’s attacking play against Aston Villa:

TOT-AVL

The boxes are the bounds of an attack, so you can see how wide and how high it went. The colour represents duration – faster attacks are more red, slower attacks with more buildup are green. What can you see here beyond a bit of a mess? Well, tons of shots, for one. Some slow, expansive buildup play, but plenty of more faster penetrative moves too, especially through the centre and to the left of the penalty box, where the first and second goals came from.

Here’s the reverse, with Aston Villa’s attacks from that game:

AVL-TOT

Much less going on here, a lot of wide, flat moves, not a ton of penetration.

Here’s Liverpool against Chelsea:

LIV-CHE

Lots going on in the middle, including a few signs of pace. Chelsea’s chart is pretty abject though:

CHE-LIV

I mean, at least they’re starting high up the pitch, but these slow, spacey moves don’t seem that scary, and they’re not pushing far into the box. Those tiny, slightly redder boxes? I thought they were a bug, but no – the one near the half way line is Oscar winning the ball and shooting from 40-odd yards. The one in the box is Falcao winning a header after a rebound of Sakho from an Oscar shot (remember we don’t follow moves across rebounds).

But if you want pure comedy value, let’s have a look at Crystal Palace’s 0-0 draw with Man Utd:

CRY-MUN

Not a lot going on here, but Palace one of teams with shortest moves in the league and that shows here, on top of a little bit of excitement on that right-hand side of the box. But forget all of that, up next is the single saddest chart I have ever seen in my life:

MUN-CRY

I shit you not. Now, this isn’t every shot Man Utd took, they had a free-kick on target if you remember, and those don’t show up in this data. But seriously, this was what their slow, rambling build-up looked like when it actually happened. Good clean sheet, though.

So… the busier these get the harder they are to parse, I think, but I still like them. If anyone has any ideas for different ways they’d like to see this data mangled, by all means get in touch. Have REPL, will program. And if there are any particular games you’d like to see this way, just ask and I’ll tweet them out.

Visualising Attacking Shape

Attacking, Fast and Slow: Tottenham Edition

One of the numbers that stuck out to me when I calculated the data in Attacking, Fast and Slow, was the slow pace of Tottenham’s attack. We know Pochettino values winning the ball back high up the pitch and launching fast-paced counter-attacks, so why isn’t that clearer from the data? In the light of Jake Meador‘s piece today which had a few commenters quite rightly puzzling over my numbers, I thought I’d look deeper and work out where the bugs were in my approach, and how better to present the data so it captures the nuances in Tottenham’s attack.

First off, there were issues with my data, and I’ve added a note and updated numbers to the the last post. Luckily, most of my conclusions remain correct (and in fact the correlation of attack duration from year to year is even stronger in the fixed data), but one of the big movers are indeed Tottenham, who now reside in the bottom half for attack duration.

Let’s look in more detail at exactly how quick each team’s attacks are. Here I’ve broken attacks down into 5 second buckets up to 30s, and sorted by the 0-5s bucket:

Team 0-5s 5-10s 10-15s 15-20s 20-25s 25-30s 30s+
Southampton 47 22 20 13 10 4 28
Tottenham Hotspur 40 20 21 15 18 11 29
Arsenal 39 21 32 25 17 12 35
Liverpool 38 27 16 9 11 7 38
Aston Villa 34 17 9 7 8 5 23
Leicester City 34 30 28 21 8 2 20
Norwich City 33 23 12 16 13 7 29
Crystal Palace 33 21 19 13 9 4 17
Manchester City 33 24 30 16 14 13 48
Bournemouth 30 22 10 10 6 7 22
Watford 30 22 21 11 11 5 25
Chelsea 28 17 23 11 10 11 29
West Bromwich Albion 25 14 14 8 5 5 20
West Ham United 25 27 15 16 8 9 26
Sunderland 24 9 14 9 11 6 18
Everton 23 16 15 18 7 10 29
Newcastle United 19 23 14 10 7 9 23
Swansea City 18 26 8 17 15 8 32
Stoke City 16 14 15 6 14 6 20
Manchester United 16 14 10 8 9 34

And here’s what that looks like stacked up together:
shot-durations

Well that matches our intuitions much better – the two teams we know share Pochettino’s desire for quick attacks off turnovers are right there are the top, with more shots within 5s than anyone else, and with 10s numbers that stack up pretty well too. I initially worried that these numbers might just be a side-effect of weird corner numbers, but Tottenham and Southampton sit 8th and 9th in corner count.

If you look at Tottenham’s numbers in the aggregate, they’re slowed down by patient build-up play. Despite the contrast in the chart above, they can be similar to Man Utd – moving the ball from side to side, waiting for an opportunity to open up. If you remember my passing gains chart, Tottenham’s passing on average in the centre of the field is backwards. They probe forwards on the wings, recycle backwards into the centre. Eventually this leads to shots that have taken a lot of time and space in the build-up, and I’ll certainly look for better ways to categorise this. But hopefully with the approach above, people are at least now seeing the Tottenham they know and love.

Attacking, Fast and Slow: Tottenham Edition

Attacking, Fast and Slow

Note 05/11/2015: the original numbers published here were based on some faulty data – I found attacking moves that persisted even when the opposition won the ball back. This had the effect of making most moves seem longer and wider. Fortunately, after fixing that, Man Utd stay at the top and Leicester at the bottom, the changes at Newcastle and West Ham still seem real, and the correlation from year-to-year is now even stronger. Many thanks to the commenters on this post whose Tottenham spidey-sense caused me to take a second look.

I’ve been curating some data so that I can look at teams’ attacking buildup play. There’s some more in-depth stuff coming, but I thought it was fascinating to just look at the basic geometry of different teams’ attacks. So, let’s measure the passing moves that lead to shots (rebounds and direct free kicks excluded), starting with a turnover or dead ball situation. For each team I’ve calculated:

  • the average ‘X’ position, this is the position of the ‘centre’ of the move, as a percentage up the the field towards the opponent’s goal, 50 being the half-way line
  • the average width of the move, sideline to sideline, with 50 being half the pitch
  • the average height of the move, box to box, again 50 being half the pitch
  • the average duration in seconds

Let’s have a look, ordered by duration:

Team Average X Width Height Duration
Manchester United 50.3 54.0 42.6 28.7
Manchester City 48.1 55.8 43.7 25.6
Swansea City 44.2 55.7 42.7 24.0
Everton 49.7 55.5 42.8 22.4
Newcastle United 44.5 55.2 43.6 22.2
Chelsea 44.1 52.2 43.3 21.9
Stoke City 43.0 54.1 44.5 21.0
Liverpool 43.2 50.1 39.6 20.9
Norwich City 55.4 51.5 38.9 20.1
Arsenal 46.3 49.2 45.0 19.8
Tottenham Hotspur 43.1 50.3 41.7 19.8
West Bromwich Albion 47.8 50.9 40.5 19.8
Sunderland 47.0 51.9 42.1 19.6
Aston Villa 45.8 50.5 40.0 19.3
Southampton 48.3 50.3 38.6 19.3
West Ham United 48.5 52.8 40.3 19.1
Watford 44.9 48.2 41.3 18.6
Bournemouth 55.0 50.1 33.8 17.9
Crystal Palace 47.3 48.9 38.9 16.9
Leicester City 51.0 45.5 40.9 16.0

The incredibly ponderous Man Utd sit at the top of the table, giving themselves on average 28 seconds with the ball in the buildup to their shots. At the bottom are Leicester City – could they be the most direct team in the Premier League? Looking at their width number, they also seem to use less space on average in their attacks than any other team. Part of the reason is that the space you have to cover and the time it takes to cover it are of course tightly linked, but look at West Ham – short-lived attacks but making use of much more width.

What’s more interesting about these numbers it that they seem to hold over from season to season. Part of that is obviously the quality of players at a club – Leicester’s success aside, you would probably bet on the wider, slower teams in the top half of the table to secure European places over the bottom half. Better players can keep the ball longer, and can move the ball about the park more easily, so we’d expect the best teams to have higher width and duration numbers. That said, I did a quick check and the average buildup time for goals is the same as all shots, around 18-19 seconds – there’s no indication that quicker or slower is necessarily more effective in creating goals.

Here’s last year’s table:

Team Average X Width Height Duration
Manchester City 47.0 54.0 43.3 25.8
Everton 43.9 54.3 44.0 25.1
Manchester United 47.1 59.3 40.3 25.0
Chelsea 50.0 52.1 40.8 24.0
Liverpool 44.6 54.3 43.7 23.3
Southampton 47.9 52.8 40.2 21.3
West Bromwich Albion 44.1 51.5 39.6 21.2
Arsenal 50.6 48.3 40.1 21.1
Aston Villa 46.9 54.5 40.5 20.9
Swansea City 42.9 52.6 39.7 20.5
Tottenham Hotspur 43.2 52.5 40.2 20.4
Sunderland 45.7 51.9 39.5 20.3
Stoke City 44.3 51.8 40.4 19.4
Hull City 48.0 53.1 39.1 19.4
Queens Park Rangers 47.5 49.4 37.5 17.3
West Ham United 51.6 47.7 36.7 16.5
Leicester City 49.5 45.2 37.8 16.0
Newcastle United 48.3 46.2 37.8 15.9
Crystal Palace 47.8 46.1 38.2 15.5
Burnley 53.7 50.5 37.3 15.3

Almost all teams post similar numbers (duration has an R2 of about 0.8), and again you could easily explain that as player quality, but for the radical changes at Newcastle, who sacked John Carver and replaced him with Steve McClaren over the Summer. They’re now taking a whole extra 6 seconds in the buildup to their shots, and using 9% more of the field to do it in. West Ham brought in Slaven Bilic and have added 2.5 seconds and 5 percent more space. There are more outliers that spoil the story a bit – Man Utd were very wide in 2014, less so now, and both they and Swansea are building up a lot slower this year), but I think these duration and width numbers – how fast, how directly you attack – are a very clear part of a manager’s signature.

Attacking, Fast and Slow