As part of a longer-term attempt to deconstruct expected goals into a variety of different, more granular and perhaps slightly more descriptive models, I’ve knocked together an expected save model today, and I thought I’d highlight some of the more interesting results out of it. Below is the data for this year’s Premier League, containing:
- Total shots on target
- Shots on target saved
- Goals
- Expected saves – the model’s prediction of how many SoT should have been kept out
- Saves above expected – how a keeper’s actual numbers compare to their expected numbers
- Difficulty – the average difficulty of shot the keeper faced (this is calculated as
sum(1 - xs) / count(shots)) - Rating – simply saves over expected saves to make it easier to compare keepers
I’ve ordered by saves above expected because it’s a more in your face than the rating.
| Season | Keeper | Shots | Saves | Goals | Expected Saves | Saves Above Expected | Average Difficulty | Rating |
|---|---|---|---|---|---|---|---|---|
| 2015 | Jack Butland | 47 | 37 | 10 | 32.76 | 4.24 | 30.30% | 112.94% |
| 2015 | Alex McCarthy | 34 | 29 | 5 | 26.28 | 2.72 | 22.70% | 110.34% |
| 2015 | Petr Cech | 41 | 33 | 8 | 30.49 | 2.51 | 25.63% | 108.23% |
| 2015 | Hugo Lloris | 31 | 26 | 5 | 23.80 | 2.20 | 23.24% | 109.26% |
| 2015 | Heurelho Gomes | 38 | 28 | 10 | 25.94 | 2.06 | 31.74% | 107.94% |
| 2015 | Adrián San Miguel del Castillo | 30 | 22 | 8 | 20.65 | 1.35 | 31.17% | 106.53% |
| 2015 | Tim Howard | 43 | 32 | 11 | 30.97 | 1.03 | 27.98% | 103.32% |
| 2015 | David de Gea | 23 | 17 | 6 | 16.05 | 0.95 | 30.22% | 105.92% |
| 2015 | Darren Randolph | 12 | 8 | 4 | 7.43 | 0.57 | 38.08% | 107.67% |
| 2015 | Sergio Romero | 10 | 7 | 3 | 6.47 | 0.53 | 35.33% | 108.24% |
| 2015 | Thibaut Courtois | 21 | 14 | 7 | 13.77 | 0.23 | 34.45% | 101.71% |
| 2015 | Michel Vorm | 1 | 1 | 0 | 0.86 | 0.14 | 14.06% | 116.36% |
| 2015 | Kelvin Davis | 7 | 5 | 2 | 4.87 | 0.13 | 30.43% | 102.67% |
| 2015 | Lukasz Fabianski | 36 | 27 | 9 | 26.91 | 0.09 | 25.26% | 100.35% |
| 2015 | Carl Jenkinson | 5 | 3 | 2 | 3.01 | -0.01 | 39.79% | 99.65% |
| 2015 | Joe Hart | 16 | 12 | 4 | 12.18 | -0.18 | 23.86% | 98.50% |
| 2015 | Adam Federici | 11 | 6 | 5 | 6.53 | -0.53 | 40.67% | 91.93% |
| 2015 | Boaz Myhill | 42 | 31 | 11 | 31.61 | -0.61 | 24.73% | 98.06% |
| 2015 | Robert Elliot | 5 | 3 | 2 | 3.81 | -0.81 | 23.82% | 78.76% |
| 2015 | Simon Mignolet | 30 | 20 | 10 | 20.95 | -0.95 | 30.17% | 95.47% |
| 2015 | Wayne Hennessey | 8 | 5 | 3 | 6.04 | -1.04 | 24.48% | 82.76% |
| 2015 | Tim Krul | 49 | 33 | 16 | 34.61 | -1.61 | 29.36% | 95.34% |
| 2015 | Willy Caballero | 8 | 4 | 4 | 5.74 | -1.74 | 28.25% | 69.69% |
| 2015 | Artur Boruc | 24 | 12 | 12 | 14.03 | -2.03 | 41.52% | 85.50% |
| 2015 | John Ruddy | 45 | 25 | 20 | 27.10 | -2.10 | 39.79% | 92.26% |
| 2015 | Asmir Begovic | 32 | 19 | 13 | 21.21 | -2.21 | 33.71% | 89.57% |
| 2015 | Kasper Schmeichel | 42 | 25 | 17 | 27.49 | -2.49 | 34.55% | 90.94% |
| 2015 | Costel Pantilimon | 52 | 33 | 19 | 35.76 | -2.76 | 31.22% | 92.27% |
| 2015 | Maarten Stekelenburg | 20 | 9 | 11 | 12.41 | -3.41 | 37.95% | 72.53% |
| 2015 | Brad Guzan | 46 | 31 | 15 | 34.74 | -3.74 | 24.48% | 89.24% |
Some brief observations:
- It’ll be interesting to see who goes to Euro 2016 for England, Jack Butland and Alex McCarthy are both making a good case early in the season.
- That said, Alex McCarthy has faced the easiest shots on average of any keeper in the league (save Michel Vorm, who has had only one save to make).
- Hugo Lloris is performing above xS, but not so much that Tottenham’s 5 goals conceded is overly flattering. Lloris is another that’s right down there in the difficulty stakes, and it’ll be interesting to analyse over the coming weeks whether this is tame shot-making, or defensive organisation.
- The Brad Guzan vs Marrten Stekelenburg comparison at the bottom is fascinating – imagine if Southampton allowed as many shots as Aston Villa.
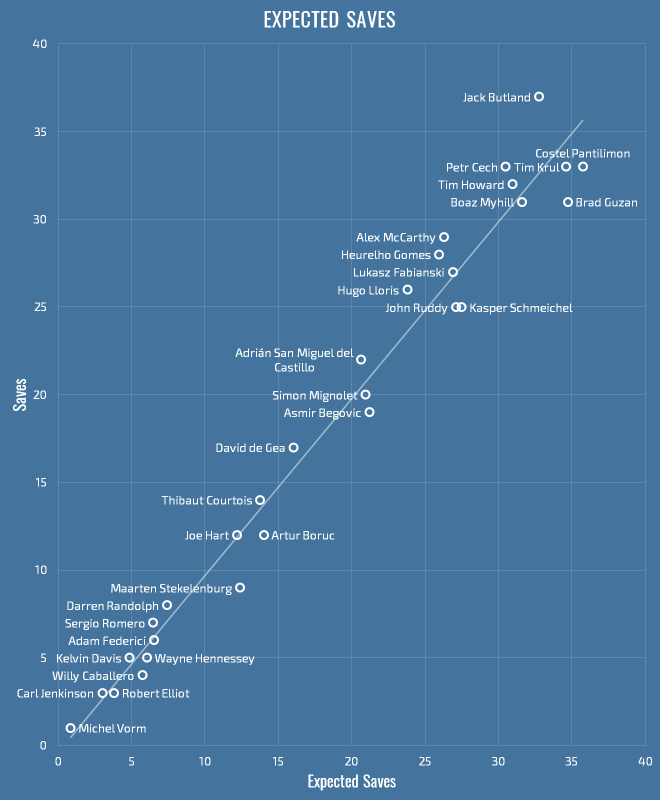
It’s early in the season, and saves are easier to make than goals (I’m not saying goalkeepers are the bassists of football, just that they save more than they let in, and strikers miss more than they score), so as you’d expect, the model matches reality fairly well so far. We can see this if plot expected saves versus saves – above the line is good, below is bad, further to the top right are the leakiest defences, bottom left are mostly backup, although Darren Randolph and Sergio Romero seem to have done fine when called upon this year.
I’ll be keeping this updated through the season and I’ll surface anything interesting I find in the historical data or across Europe. In the meantime, please enjoy the consistently inconsistent Tim Howard:
| Season | Shots | Saves | Goals | xS | xSdiff | Difficulty | Rating |
|---|---|---|---|---|---|---|---|
| 2010 | 141 | 97 | 44 | 99.48 | -2.48 | 29.45% | 97.51% |
| 2011 | 133 | 94 | 39 | 93.39 | 0.61 | 29.78% | 100.65% |
| 2012 | 128 | 89 | 39 | 85.00 | 4.00 | 33.59% | 104.71% |
| 2013 | 152 | 115 | 37 | 109.83 | 5.17 | 27.74% | 104.70% |
| 2014 | 109 | 65 | 44 | 72.81 | -7.81 | 33.20% | 89.28% |
| 2015 | 43 | 32 | 11 | 30.97 | 1.03 | 27.98% | 103.32% |

[…] Expected Saves […]
LikeLike
[…] Expected Saves […]
LikeLike
[…] Expected Saves […]
LikeLike
[…] because frankly it’s easiest to draw up a naughty list of of rubbish keepers using our expected saves model. Below is the list of all keepers that have on average underperformed in the last five […]
LikeLike
[…] are essentially nonexistent. The likes of Opta analyst Johannes Harkins, Paul Riley and Lawrence have offered other means by which shotstopping may be assessed, whilst Jörg Seidel has written on […]
LikeLike
[…] Expected Saves […]
LikeLike
[…] by a few in the “analytics community”, such as American Soccer Analysis and Deep xG. It has been very interesting to see these talented analysts and writers develop these stats for […]
LikeLike
[…] by new Roma analytics guru, Stephen McCarthy, Colin Trainor & Constantinos Chappas and Thom Lawrence in the […]
LikeLike
[…] saves have been discussed in the football analytics research community for a while — Thom Lawrence (@deepxg) described results from (but did not present details of) an expected saves model in 2015, […]
LikeLike